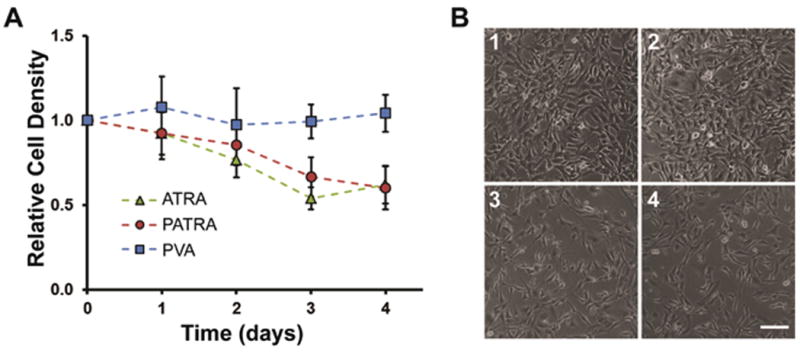
Figure 5. Comparison of impact of ATRA and PATRA on cell viability.

(a) Relative cell density of cell cultures treated with ATRA, PATRA, or PVA. ATRA in-well concentration was set at 10μM and PATRA concentration was set at an equivalent ATRA concentration. The concentration of PVA was determined by the PVA concentration in PATRA treated wells. (b) Brightfield imaging after four days in culture of NIH-3T3 cells that are either untreated (1) or treated with (2) PVA, (3) PATRA, (4) ATRA. Scale bar = 50 μm. Data shown is mean ± S.D., n=5.
