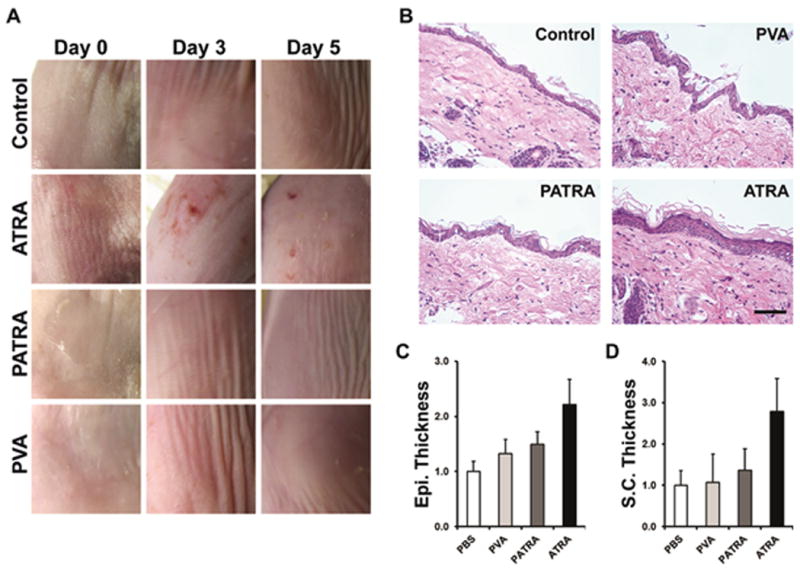
Figure 7. Reaction to ATRA application to the dermis.

(a) Digital imaging of mouse dermis 0, 3, and 5 days post-application. (b) Histological sections of treated mouse dermis. Changes in epidermal and stratum corneum thickness are clearly observed due to bolus administration of ATRA. These changes are not observed in other treatment groups. (c-d) Quantification of histological findings for the treatment groups after five days. Data shown are mean ± S.D., n = 4.
