Figure 8.
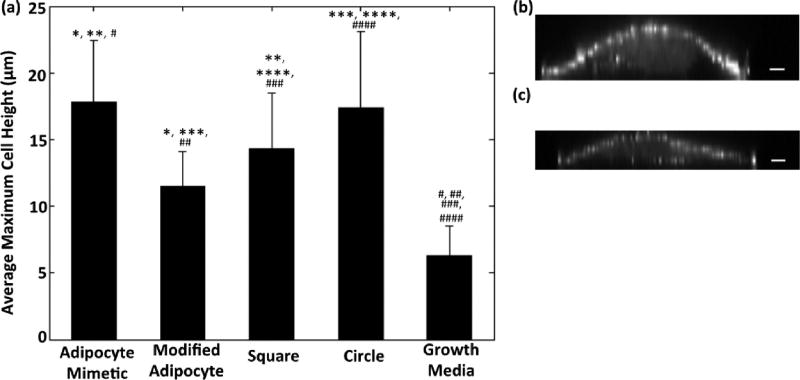
Average maximum HMSC height at 7 days in culture. (a) HMSCs on adipocyte mimetic (n = 33), modified adipocyte (n = 35), square (n = 24), and circle (n = 33) patterns, as well as cells cultured in growth media (no patterns, n = 35) (p < 0.05: modified adipocyte (*) and square (**) compared with adipocyte mimetic; adipocyte mimetic (#), modified adipocyte (##), square (###), and circle (####) compared to growth media; modified adipocyte (***) and square (****) compared to circle). (b) YZ profile of HMSC on adipocyte mimetic fibronectin pattern (scale bar = 5 µm). (c) YZ profile of HMSC on modified adipocyte fibronectin pattern (scale bar = 5 µm). Data are shown as mean ± standard deviation; significance was calculated using one-way ANOVA with a Tukey posthoc analysis.

