
Fig. 8.
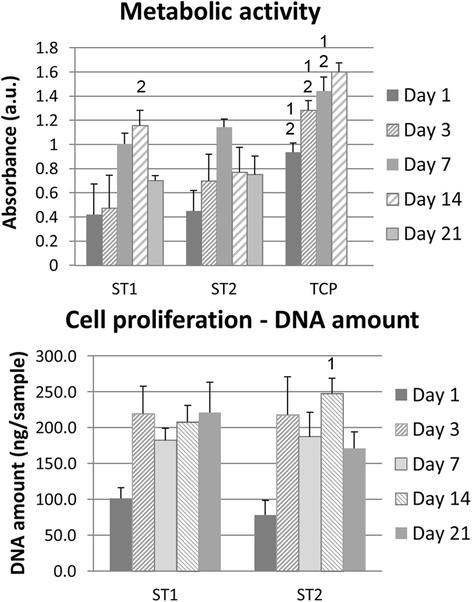
Metabolic activity and dsDNA. Metabolic activity and dsDNA amount are presented as mean of absorbance and standard deviation. Statistical differences compared to ST1 (1) or ST2 (2) groups are shown in graphs above SD values. Metabolic activity was higher on tissue culture polystyrene (TCP) compared to both scaffolds during 14 days; similar results were found for ST1 and ST2 scaffolds, except for higher absorbance on ST1 scaffolds compared to ST2 on day 14. Contrary, higher dsDNA amount was found on ST2 scaffolds than on ST1 scaffold on day 14