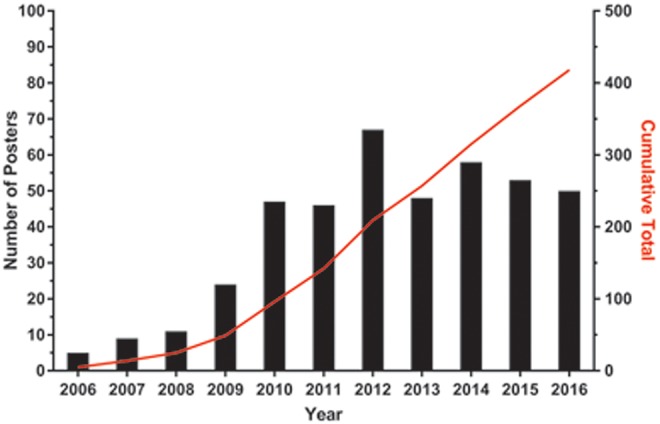
Figure 2.

Poster presentations by the summer undergraduate research participants at UND SMHS. The bar graph shows the total number of posters presented each year from students who participated in a research experience at UND SMHS from 2006 through 2016. The red line graph shows the cumulative total of undergraduate poster presentations from 2006 through 2016. SMHS indicates School of Medicine and Health Sciences; UND, University of North Dakota.
