
Figure 1.
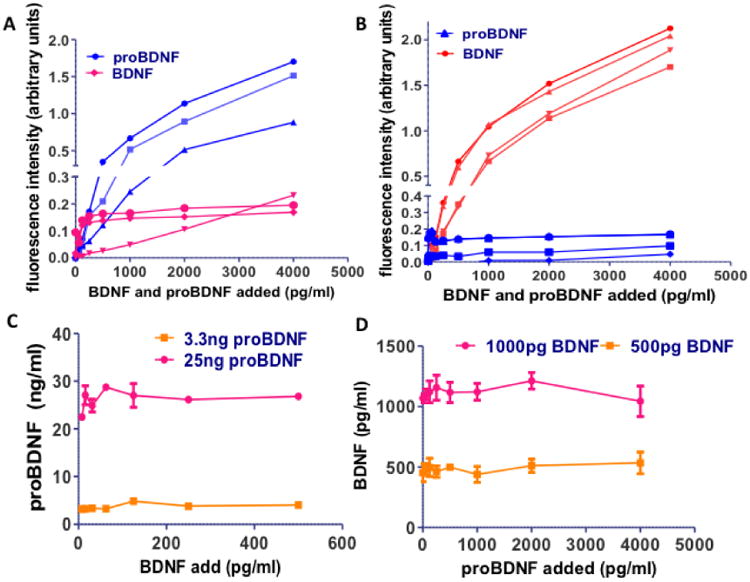
Recombinant BDNF was added in concentrations of 62-4000 pg/dl to proBDNF ELISA plates (A) and recombinant proBDNF was added in concentrations of 62 – 4000 pg to BDNF ELISA plates (B). The signal produced was compared to the signal produced by the same concentration of recombinant proBDNF (A) or recombinant BDNF (B). Each curve represents a separate experiment on a separate ELISA plate, while the samples were run in duplicates. C. On a proBDNF ELISA plate, increasing concentrations of recombinant BDNF were added to 3.3 or 25 ng of recombinant proBDNF and the measured concentration of proBDNF was calculated based on the standard curve produced by pure recombinant proBDNF. The fact that the line remains almost horizontal at the excpected concentration shows the reproducibility of the ELISA and its validity when measuring mixtures of BDNF and proBDNF. D. On a BDNF ELISA plate, increasing concentrations of recombinant proBDNF were added to 500 or 1000pg of recombinant BDNF and the measured concentration of BDNF was calculated based on the standard curve produced by pure recombinant BDNF. The fact that the line remains almost horizontal at the excpected concentration shows the reproducibility of the ELISA and its validity when measuring mixtures of BDNF and proBDNF.