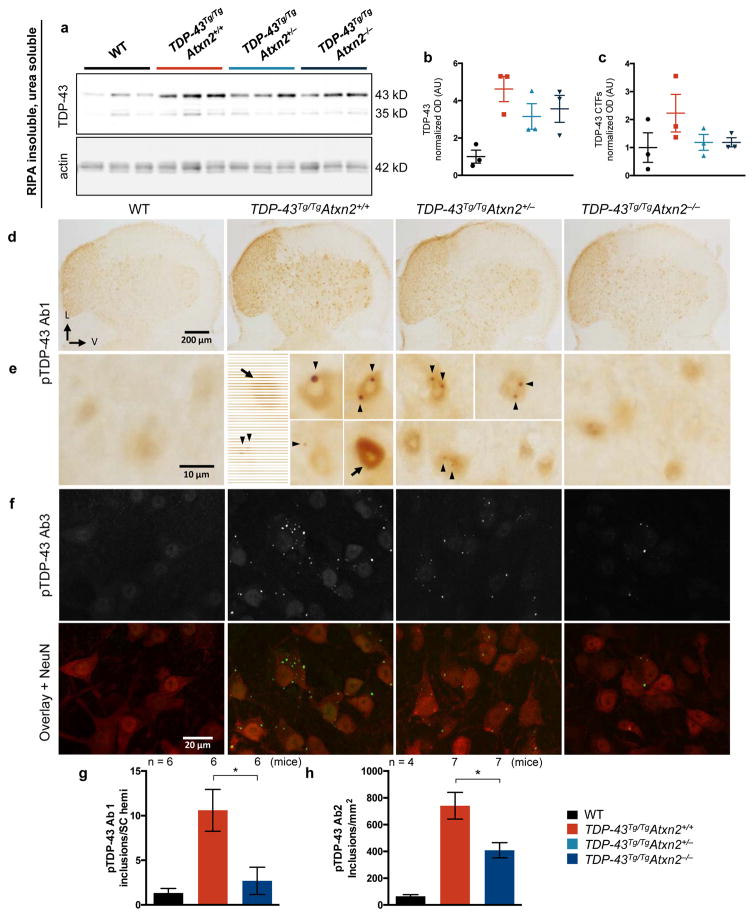
Figure 3. Lowering ataxin 2 levels decreases TDP-43 pathology.
a) RIPA-insoluble, urea soluble full-length and CTF TDP-43 are elevated in TDP-43Tg/TgAtxn2+/+ mice (quantified b–c), and appeared moderately reduced in TDP-43Tg/TgAtxn2−/− mice (source data in SI Fig. 1). d) Lumbar spinal cord hemispheres (SC hemi) stained with pTDP-43 Ab1. e) Magnification to the cellular level reveals weak, diffuse nuclear staining in WT mice, and pTDP-43 inclusions (arrow heads) and strong diffuse nuclear pTDP-43 (arrows) in TDP-43Tg/TgAtxn2+/+ mice. Fluorescent stains (Extended Data Fig. 6e) demonstrate that most pTDP-43 Ab1 inclusions are nuclear. f) pTDP-43 Ab3 reveals inclusions that are much more numerous and usually cytoplasmic (Extended Data Fig. 6g). Lowering ataxin 2 decreased pTDP-43 Ab1 inclusions at P21 (g), and pTDP-43 Ab2 inclusions at P23 (h) in lumbar spinal cord. Two-tailed t-tests were performed between groups of interest. Means are plotted, and error bars indicate S.E.M. *p < 0.05

