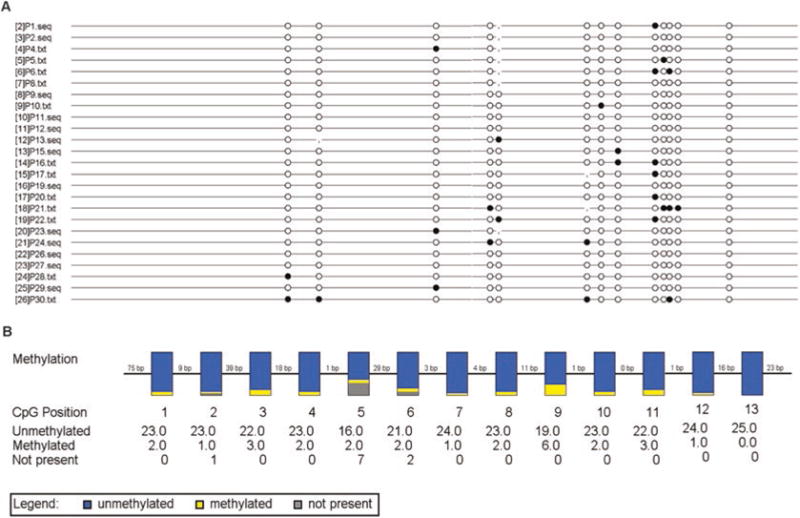
Fig. 2.

BiQ Analyzer output of the methylation status of HBV cccDNA CpG island III. (a) Lollipop diagram: The black and white circles represent methylated and unmethylated CpG dinucleotides, respectively. (b) Box diagram: The vertical box indicates all HBV DNA clones from patients at corresponding CpG position. The blue and yellow regions represent the proportion of unmethylated and methylated clones, respectively. The gray color refers to the absence of CG dinucleotide due to single nucleotide polymorphism. The number of unmethylated and methylated clones is listed under the corresponding dinucleotides
