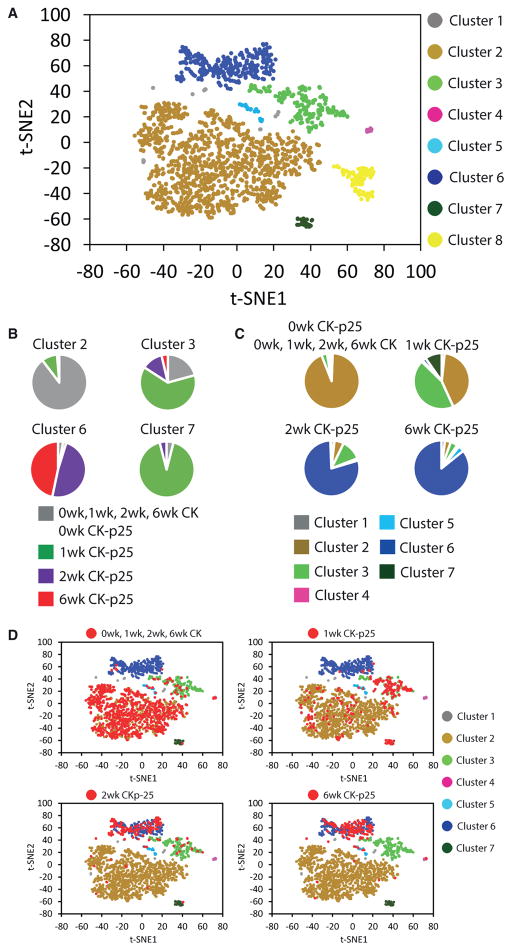
Figure 2. Non-linear Dimensionality Reduction Reveals Multiple Distinct and Disease Stage-Specific Microglia Cell States.
(A) Clustering of 1,685 CD11b and CD45 double-positive cells isolated from the hippocampus into eight populations. The t-SNE plot shows a two-dimensional representation of global gene expression profile relationships among 1,685 cells.
(B) Pie charts showing the composition of some of the clusters identified in (A).
(C) Pie charts showing the distribution of each group of cells indicated across the clusters identified in (A) (excluding cluster 8). Cells are grouped by genotype and time point.
(D) t-SNE plots as shown in (A). Cells isolated from CK control mice (at all four time points) and cells from CK-p25 mice 1, 2, and 6 weeks after p25 induction (0wk, 1wk, 2wk, and 6wk, respectively) are highlighted in red in individual panels.

