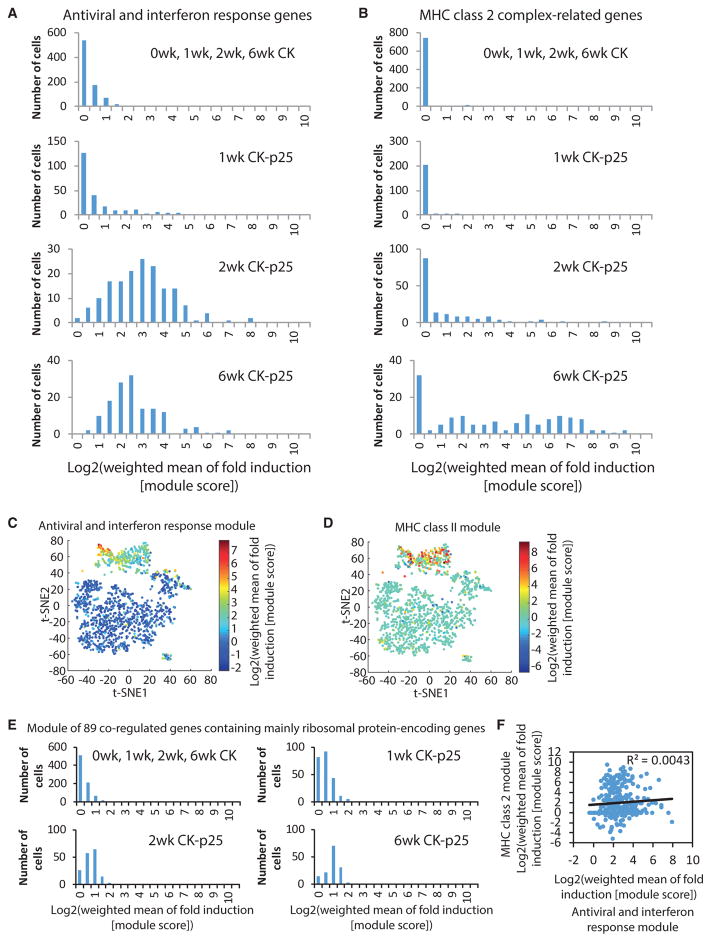
Figure 6. Two Distinct Reactive Microglia Phenotypes in Late Response to Neurodegeneration.
(A and B) Histograms showing the distribution of the weighted fold induction of a module of 132 antiviral and interferon response genes (A) and four MHC class II complex-related genes (B) across the cells of the groups indicated.
(C and D) t-SNE plots as shown in Figure 2A. Data points are colored by the weighted fold induction of (C) a module of 132 antiviral and interferon response genes and (D) a module of four MHC class II complex-related genes.
(E) Histograms showing the distribution of the weighted fold induction of a module of co-regulated genes mainly containing ribosomal protein-encoding genes across the cells of the groups indicated.
(F) Scatterplot showing the correlation between the induction of the antiviral and interferon response module and the MHC class II module across the cells isolated from CK-p25 mice 2 and 6 weeks after p25 induction.

