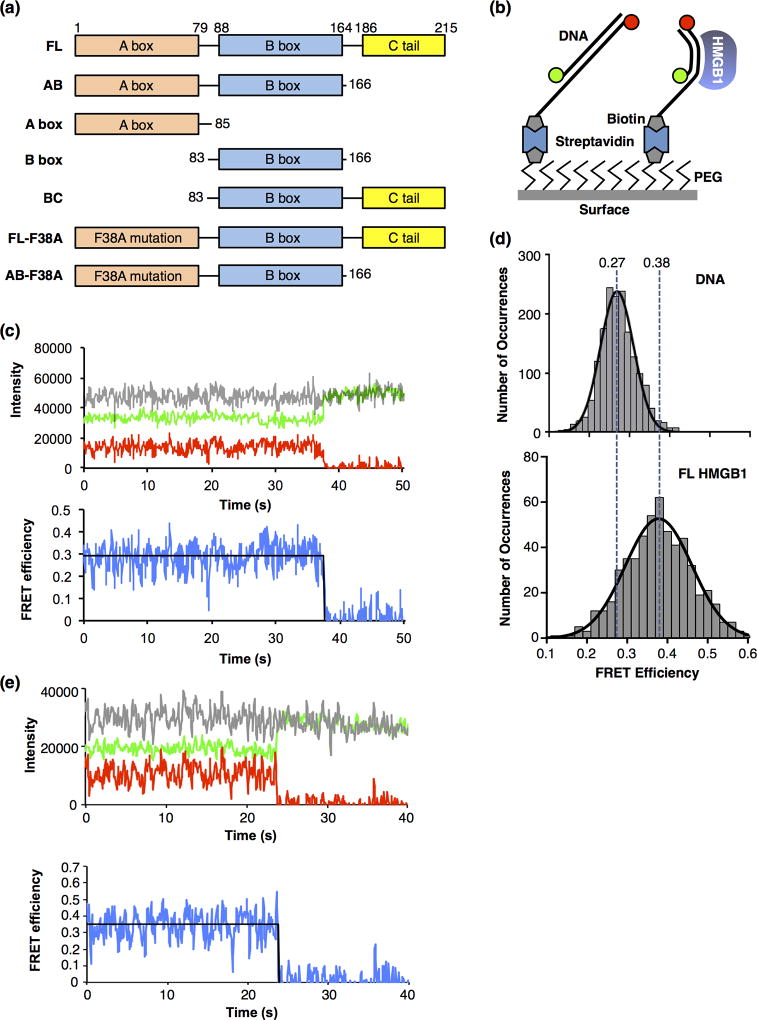
Figure 1.
Full length HMGB1 bends DNA molecules, as detected using smFRET. (a) Domain structures of full length human HMGB1 (FL) and the truncations and mutations used in this study. (b) Depiction of the surface used for the smFRET experiments. The glass coverslip was coated with polyethylene glycol (PEG) to prevent nonspecific interactions of the proteins and DNA with the surface. Some PEG molecules were functionalized with biotin, which allowed immobilization of streptavidin and biotinylated DNA labeled with donor and acceptor fluorophores (green and red circles). When HMGB1 bends the DNA (right side), the donor and acceptor fluorophores move closer together, resulting in a higher FRET efficiency than the unbent DNA (left side). (c) A representative time trace of the fluorescent signals from a single molecule of linear DNA. The upper plot shows emission from the donor fluorophore (green), acceptor fluorophore (red), and the sum of the donor and acceptor (grey) over time. The lower plot shows the FRET efficiency (blue) calculated from the donor and acceptor emissions, and the fit of the FRET efficiency (black line) over time. The acceptor dye photobleached at 38 s, resulting in a loss of FRET and an anticorrelated change in the donor fluorophore. For purposes of display, the signals were smoothed by averaging 3 adjacent time frames. (d) HMGB1 (FL) bends DNA to a single state. The upper plot shows 1701 FRET occurrences for DNA in the absence of protein. The data were fit to a Gaussian and the mean FRET efficiency is 0.27. The lower plot shows 553 FRET occurrences for DNA in the presence of 50 nM FL HMGB1. The data were fit to a Gaussian and the mean FRET efficiency is 0.38. The vertical dashed lines are centered over the mean FRET efficiencies and illustrate the HMGB1-induced increase in FRET due to DNA bending. (e) A representative time trace of the fluorescent signals from a single molecule of DNA bent by HMGB1. The upper plot shows emission from the donor fluorophore (green), acceptor fluorophore (red), and the sum of the donor and acceptor (grey) over time. The lower plot shows the FRET efficiency (blue) calculated from the donor and acceptor emissions, and the fit of the FRET efficiency (black line) over time. The acceptor dye photobleached at ~24 s, resulting in a loss of FRET and an anticorrelated change in the donor fluorophore. For purposes of display, the signals were smoothed by averaging 3 adjacent time frames.

