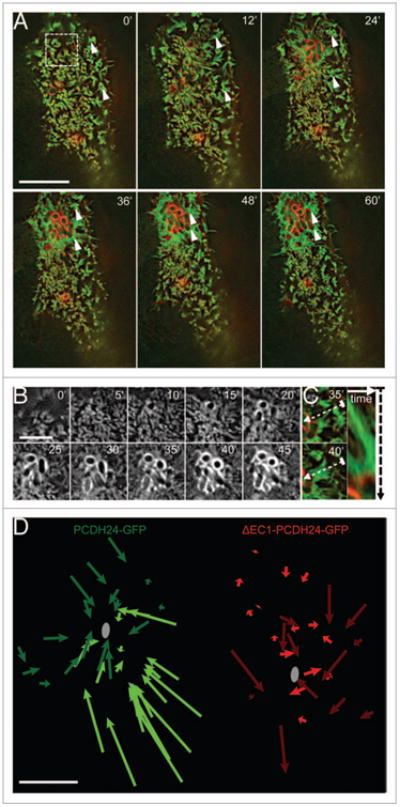
Figure 1.

Brush border microvilli flow toward sites of EPEC attachment. (A) Time-lapse images of EPEC infected caco-2BBE cell expressing PCDH24-GFP (green) and mcherry-Utrch (red). Microvilli cluster and flow (arrowheads) toward the site of bacterial attachment; scale bar = 10 μm. (B) Time-lapse images of actin (mcherry-Utrch) accumulation and pedestal formation in cell shown in (A); scale bar = 5 μm. (C) Example of clustered microvilli on cell shown in (A) flowing toward developing pedestal. Right: Kymograph of microvillar cluster along dashed line between frames shown at Left. (D) Plots of microvillar flow in Caco-2BBE cells expressing GFP-tagged full-length PCDH24 (green) or the dominant negative ΔEC1-PCDH24 (red). Shades indicate different cells; gray circles represent site of bacterial attachment closest to each microvillus tracked. Scale bar = 5 μm.
