Figure 2.

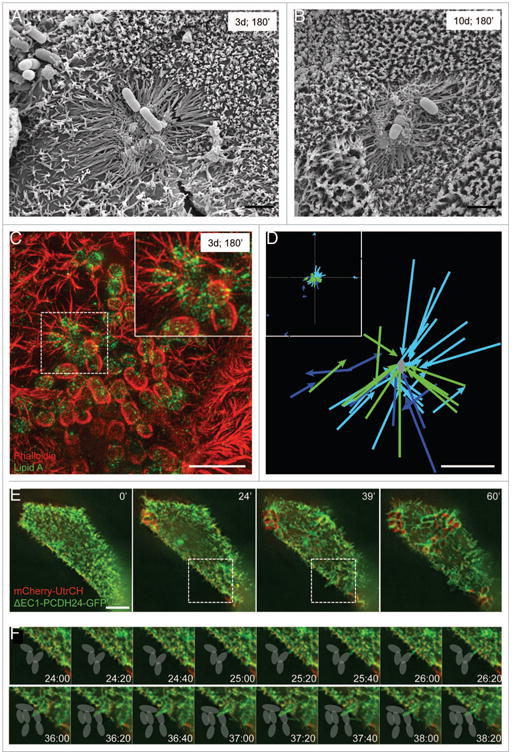
For figure legend see page 508. EPEC stimulates directed microvillar elongation. (A, B) SEM images of microvillar elongation surrounding developing microcolonies 3 d (A) and 10 d (B) post-confluency, following a 3 h incubation with EPEC. (C) SIM image of microvilli elongating toward an attaching EPEC prior to pedestal formation. Dashed square outlines the area magnified in the inset. (D) Plot of elongating microvilli relative to nearest EPEC. Inset: lower magnification of entire field shows random examples of microvilli elongating independent of bacterial stimulation. Each color represents an individual cell. Microvillar tips were tracked until the protrusion reached its max length. (E) Frames from time-lapse deconvolution of EPEC-infected cell expressing ΔEC1-PCDH24-GFP (green) and mcherry-Utrch (red). (F) Individual frames of region indicated by box in (E, middle images), showing microvillar elongation toward bacteria attached to a neighboring cell. Gray ovals indicate location of bacteria. Scale bars = 2 μm (A, B, D), 5 μm (C, E).
