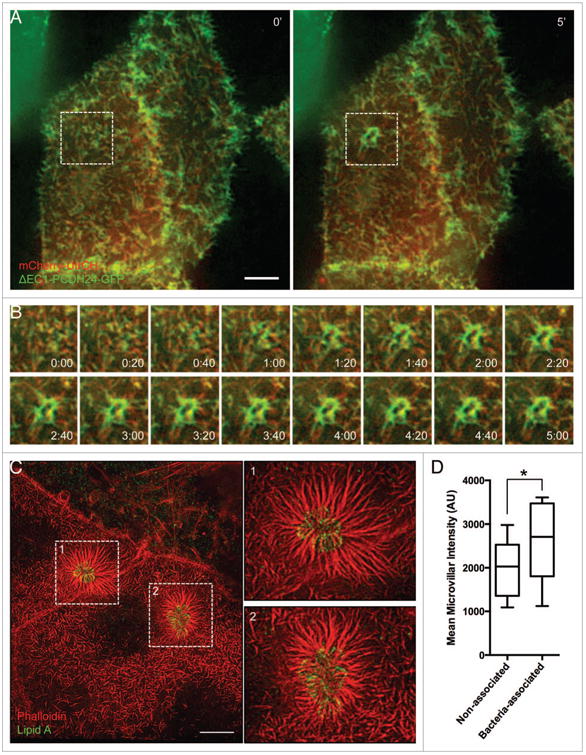
Figure 3.

Loss of T3ss function eliminates pedestal formation, but not microvillar elongation. (A) Time-lapse images of ΔEscN-EPEC infected Caco-2BBE cells expressing ΔEC1-PCDH24-GFP (green) and mcherry-Utrch (red). (B) Individual frames of region outlined in (A). Microvillar elongation at sites of attachment occurs on the same time scale as cells infected with WT EPEC. Membrane accumulates around the bacteria, but actin pedestals do not form. (C) SIM image of dense network of microvilli accumulating and elongating around ΔEscN-EPEC. (D) Increased average actin intensity of microvilli that are infected with ΔEscN-EPEC compared with microvilli on the same cells that are not interacting with bacteria. Mean intensity of each microvillus was measured by line scan, and data represent the average of 6 cells, with 35–105 microvilli measured per cell. *P < 0.05. Scale bars = 5 μm.
