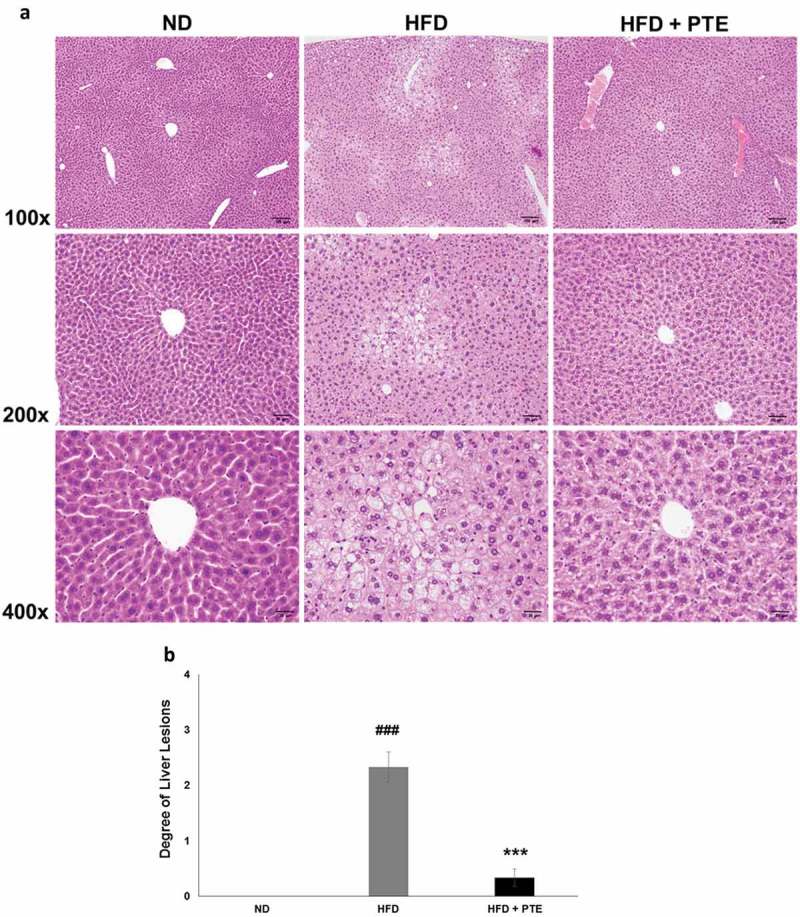
Figure 4.

Treatment with PTE attenuated HFD-induced liver lesion. Comparison of histopathological alterations of the liver in the ND, HFD control, and PTE groups. (a) Tissue sections were prepared and stained with hematoxylin and eosin. The sections were photographed at 100×, 200×, and 400× magnifications. Scale bars = 100, 50, and 20 μm at each magnification, respectively. (b) Quantification of liver lesion histology. Significant differences between ND and HFD group are indicated by ###p < 0.001; HFD and PTE group are indicated by ***p < 0.001.
