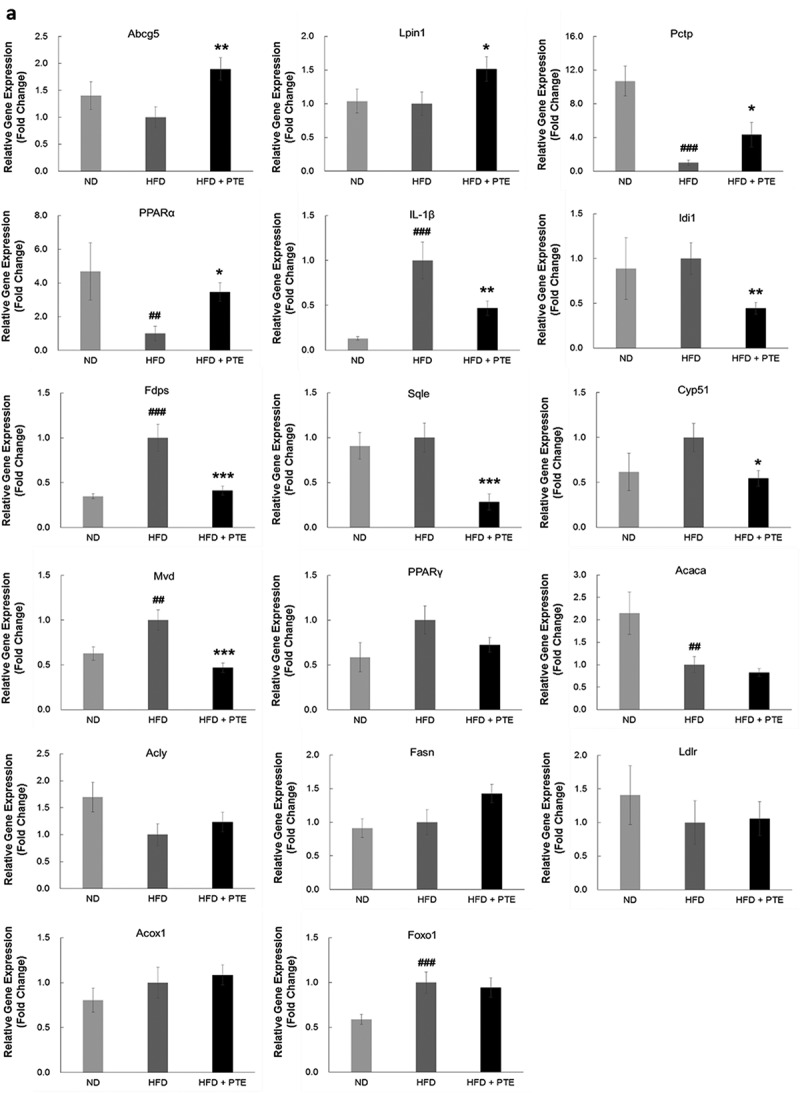
Figure 5.

Confirmation of PTE-induced differentially expressed genes using real-time PCR. (a) The genes showing differential expression in the RNA-seq study were verified using real-time quantitative PCR. Expression of each gene was normalized to that of β-actin and hypoxanthine guanine phosphoribosyl transferase (HPRT) genes. (b) Dot plot displaying the relative degrees of differential expression of selected genes. Fold changes indicate the gene expression in the PTE treatment group relative to that in the HFD control group. Data are presented as the mean ± SEM. Significant differences between the ND group and HFD control group are indicated by #p < 0.05, ##p < 0.01, and ###p < 0.001. Significant differences between the PTE group and HFD control group are indicated by *p < 0.05, **p < 0.01, and ***p < 0.001.
