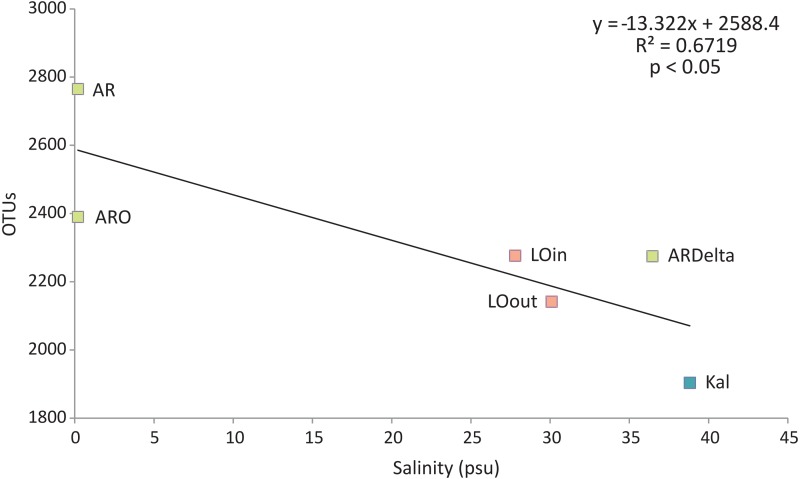
Figure 6. Linear regression between the number of OTUs (averaged per sampling station) and the salinity of the sampling stations.
Color according to habitat. AR, Arachthos; ARO, Arachthos Neochori; ARDelta, Arachthos Delta; LOin, Logarou station inside the lagoon; LOout, Logarou station in the channel connecting the lagoon to the gulf; Kal, Kalamitsi.

