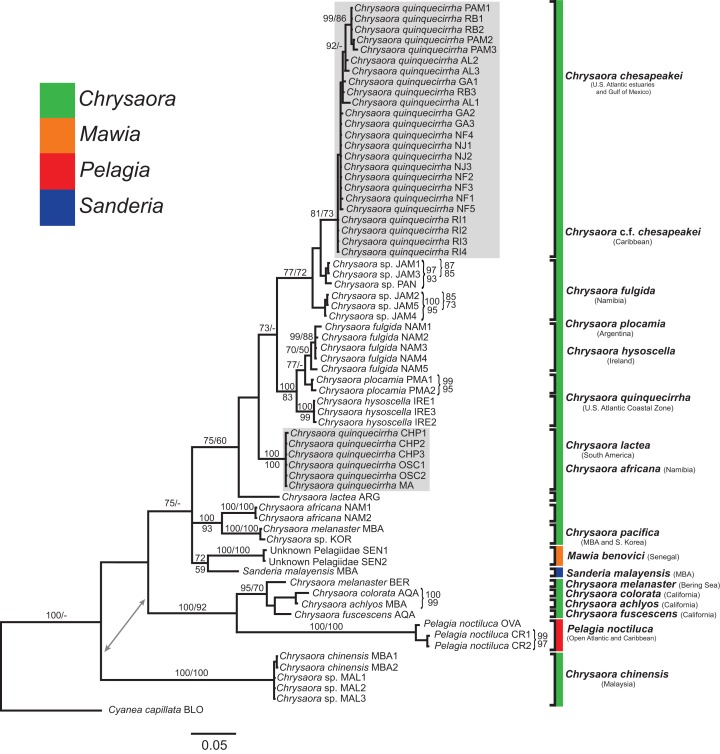
Figure 5. Pelagiidae 16S Phylogeny.
Bayesian inference (BI) 16S tree reconstructed from MAFFT alignment using Mr. Bayes v3.2.4 and applying the GTR+I+G model of sequence evolution. Numbers adjacent to branches show bootstrap support if ≥0.70 (presented as a percentage), followed by bootstrap support from maximum likelihood (ML) analysis if ≥50%. ML phylogeny was reconstructed using PhyML v3.0 (Guindon et al., 2010) applying the TIM2+I+G model of sequence evolution (-lnl 3641.97519) as determined by jMODELTEST v2.1.7 (Darriba et al., 2012). Gray arrows indicate nodes that are alternated in the ML tree. Abbreviations refer to Tables 1 and 2. Specific identification to the right of the tree indicates final species designations. Clades colored in gray were originally identified as Chrysaora quinquecirrha s.l. Norfolk (VA) individuals NF1–NF3 were identified as white morph and individuals NF4–NF5 as red-striped bell morphs (Figs. 3D and 3E).

