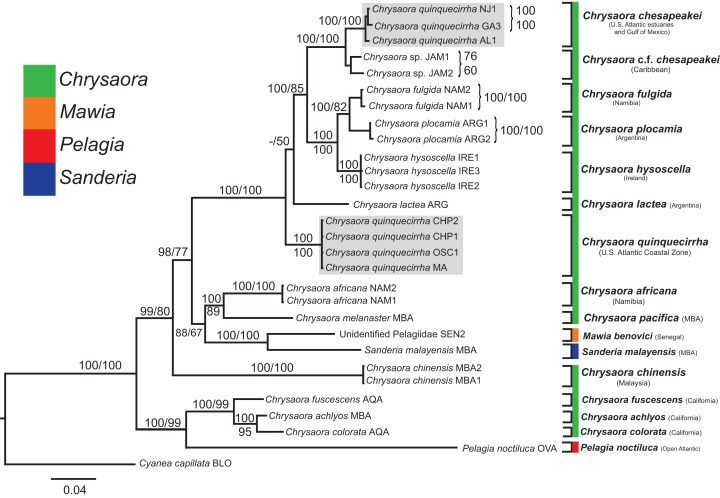
Figure 7. Pelagiidae combined phylogeny.
Bayesian inference (BI) tree of the combined dataset applying the GTR+I+G model of sequence evolution. Numbers adjacent to branches show bootstrap support if ≥0.70 (presented as a percentage), followed by bootstrap support from maximum likelihood (ML) analysis if ≥50%. ML phylogeny was reconstructed using PhyML v3.0 (Guindon et al., 2010) applying the GTR+I+G model of sequence evolution (−lnl 11924.23655) as determined by jMODELTEST v2.1.7 (Darriba et al., 2012). Specific identification to the right of the tree indicates final species designations. Clades colored in gray were originally identified as Chrysaora quinquecirrha.

