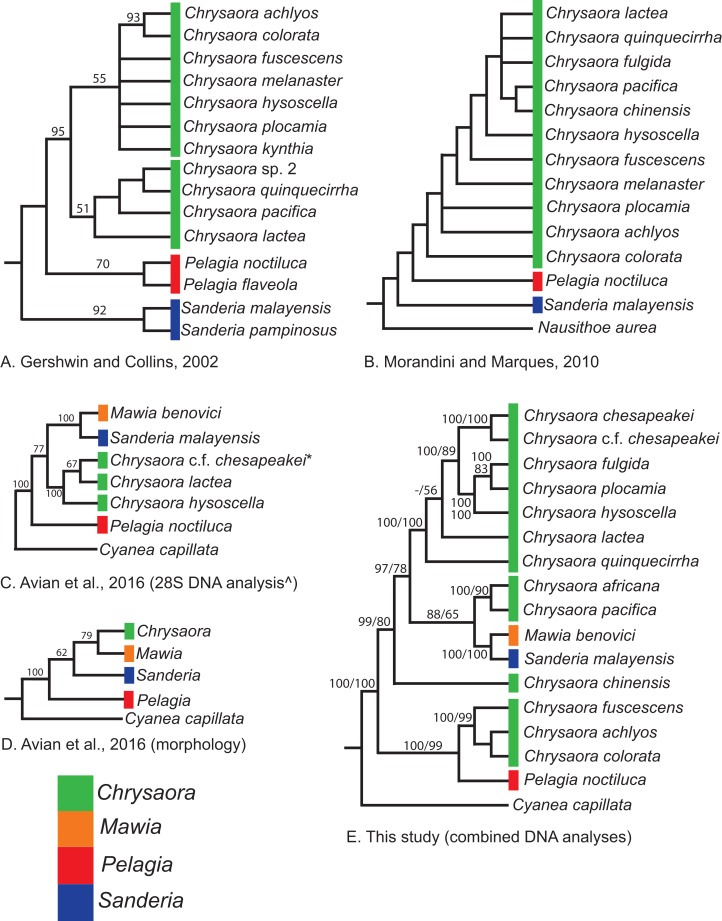
Figure 9. Pelagiidae evolution.
Cladograms showing genus-level relationships within the Pelagiidae family. Colors represent individual genera as shown. (A) Gershwin & Collins (2002); (B) Morandini & Marques (2010); (C) Avian et al. (2016): DNA analysis based on nuclear 28S; (D) Avian et al. (2016): morphological analyses only; (E) This study: Combined DNA analysis using sequence data from COI, 16S and 28S. *In Avian et al. (2016), this sequence is marked as Chrysaora sp. AY920779. This sequence is included in our analysis and is part of the clade that we call Chrysaora c.f. chesapeakei. ^We include the 28S phylogeny from Avian et al. (2016) because it has more species than their combined analysis but their generic conclusions are identical. Note that all previous hypotheses include a monophyletic Chrysaora.

