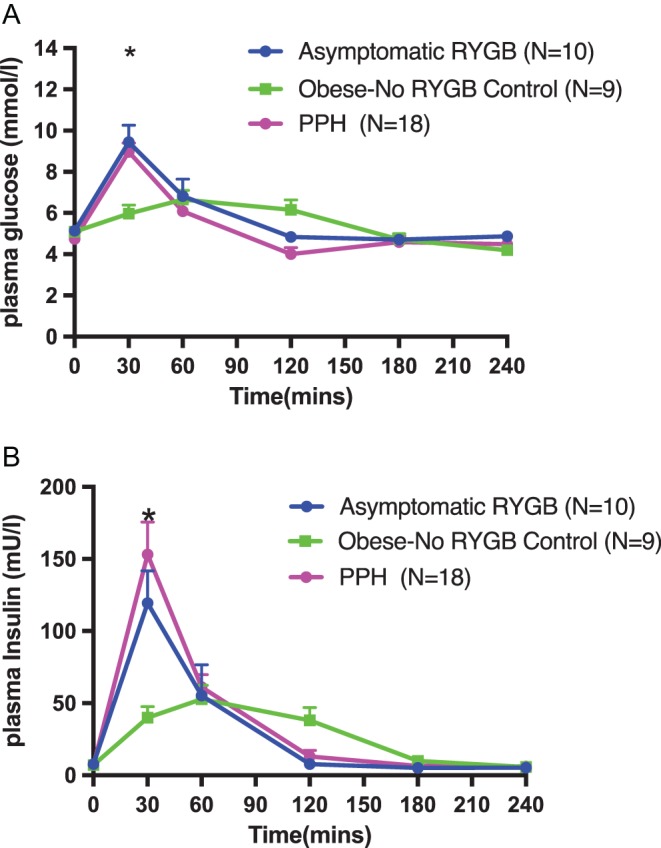
Figure 1.

Changes in plasma glucose (A) and serum insulin (B) following a MMT in patients with symptomatic PPH, a non-surgical obese group and an asymptomatic RYGB group. Mixed meal was given at T = 0. Numbers of subjects in each group shown in brackets. Data is shown as mean ± s.e.m. Statistically significant differences are shown as *PPH vs Obese-No RYGB P < 0.001, asymptomatic-RYGB vs Obese-No RYGB P < 0.001. **PPH vs Obese-No RYGB P < 0.001.

 This work is licensed under a