Figure 2.

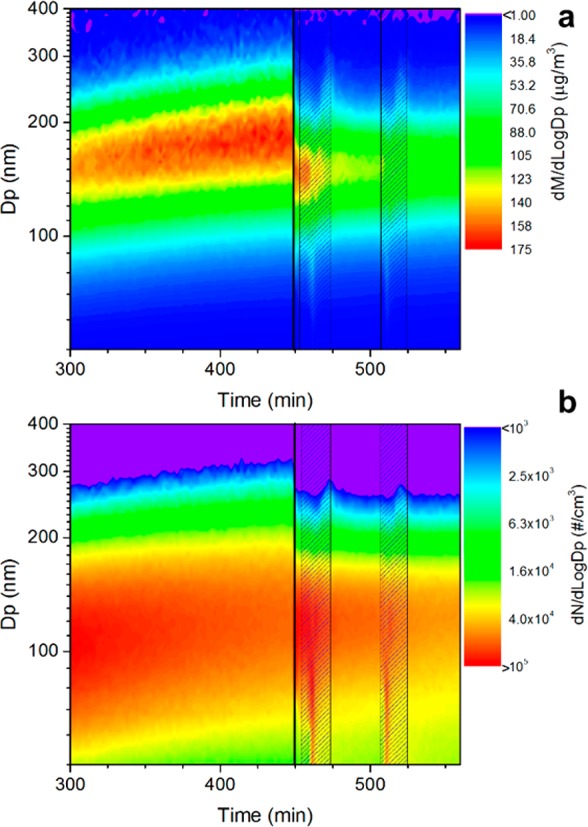
Particle mass (a) and number (b) size distributions for the experiment MT-18012013. Black line indicates time at which the RH was increased from 3 to 5% to >80%; hatched areas indicate cloud events.

Particle mass (a) and number (b) size distributions for the experiment MT-18012013. Black line indicates time at which the RH was increased from 3 to 5% to >80%; hatched areas indicate cloud events.