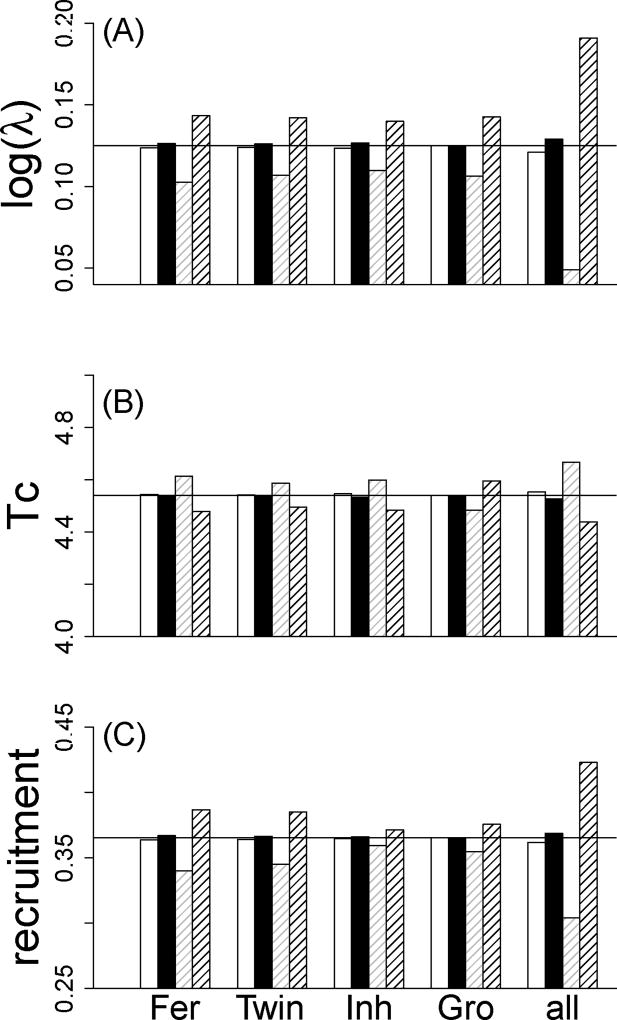
Figure 3.
Influence of unmeasured individual differences compared to the influence of variation in environmental conditions on three parameters describing population dynamics: the population growth rate (log(λ), A), the cohort generation time (Tc, B) and the mean recruitment rate (C). Two populations of different (high (black) and low (white)) average performance were compared to two populations facing contrasting (favorable (black hatched) and unfavorable (grey hatched)) years using the model 6 (Table 1). Median parameters are represented by a black solid line. Each function was successively perturbed (Realized fertility, Twinning rate, Inheritance and Growth) before being all perturbed at same time (all).

