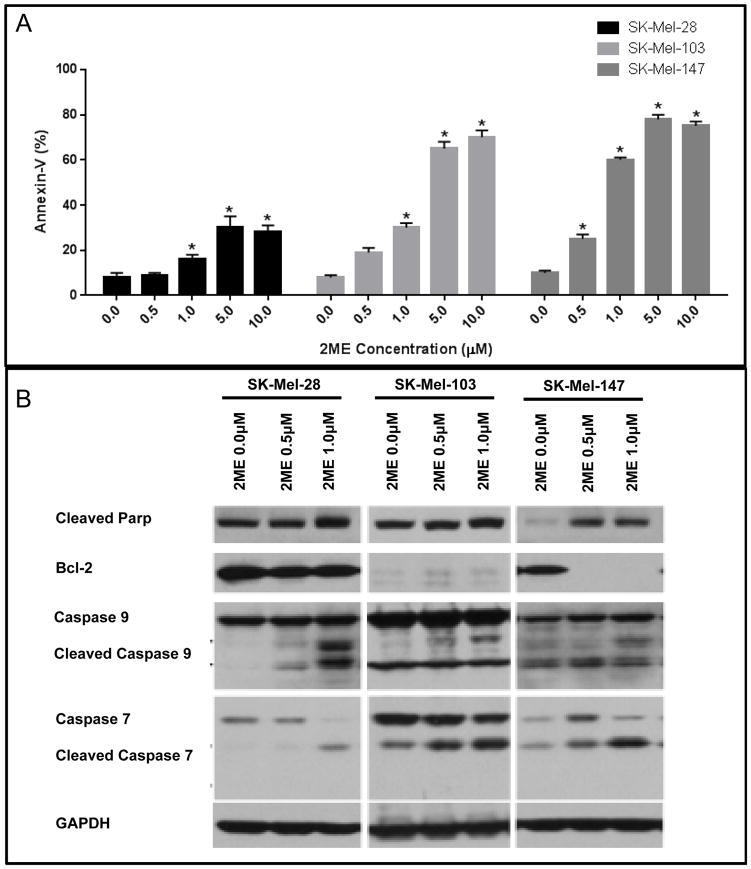
Figure 3.
Apoptotic cell death induced by 2ME treatment. (A) Flow cytometry analysis of apoptotic cell death (Annexin V positive cells) after treatment with 0.5, 1.0, 5.0 and 10.0 μM of 2ME for 5 days. (B) Western Blotting analysis of pro- and anti-apoptotic proteins after treatment with 2ME for 3 days. GAPDH was used as a loading control. Experiments were performed in triplicates. Values are expressed as mean ± s.d. Significance is indicated by *P<0.05, **P<0.01 and ***P<0.001.

