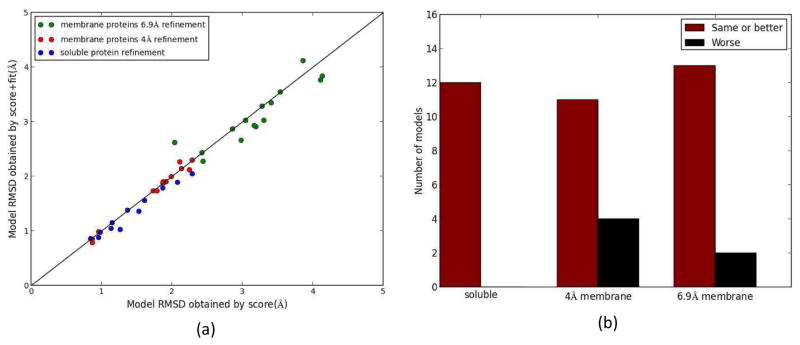
Figure 8.
(a) The RMSDs of the models that would have been picked for all Rosetta rounds using the score-only method and the consensus score method for soluble proteins (blue) and membrane protein refinement utilizing 4 Å (red) and 6.9 Å (green) density maps. (b) Histogram of occurrences that a model with lower or same RMSD was picked by the consensus score method compared to the score-only method. For soluble proteins, 4 Å membrane refinement and 6.9 Å membrane refinement the model picked was better or the same 100%, 73% and 87% of the cases respectively.

