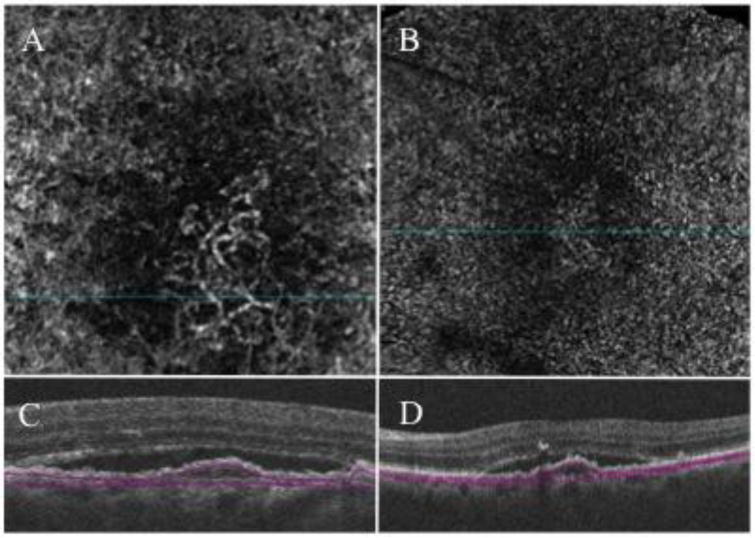
Figure 1.

Spectral-domain (SD) optical coherence tomography angiography of a type 1 choroidal neovascularization from one eye of patient with exudative age-related macular degeneration. (A) 3×3 mm en face flow angiogram extracted from the slab shown on C revealing the neovascular network of a type 1 choroidal neovascularization (CNV); (B) 6×6 mm en face flow angiogram extracted from the slab shown on D. Differently from the 3×3 mm angiogram shown on A, the CNV is almost indistinguishable from the surrounding choriocapillaris due to lower resolution of the 6×6 angiogram. (C and D) B-scan from which the 3×3 and 6×6 mm angiogram on A and C, respectively, were extracted demonstrating the boundaries of the slab; top boundary under the retinal pigment epithelium and bottom boundary under the Bruch’s membrane.
