Fig. 5.1.

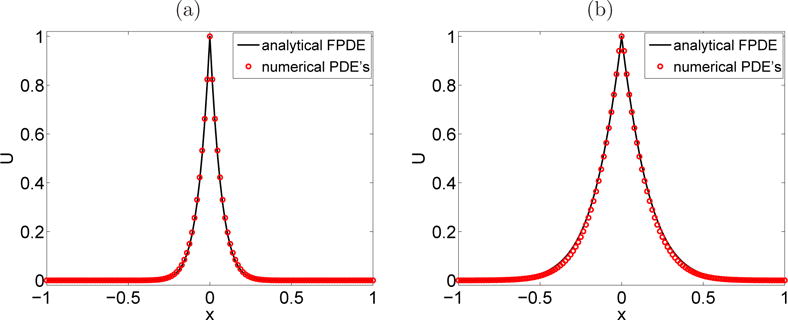
Section 5.3. Comparison between the numerical values (circle) and the analytical values (solid line) of the concentration U = eT u of A. (a): Set 1 of parameters at t1 = 5 · 10−3 s, (b): Set 2 of parameters at t2 = 1.5 · 10−1 s.

Section 5.3. Comparison between the numerical values (circle) and the analytical values (solid line) of the concentration U = eT u of A. (a): Set 1 of parameters at t1 = 5 · 10−3 s, (b): Set 2 of parameters at t2 = 1.5 · 10−1 s.