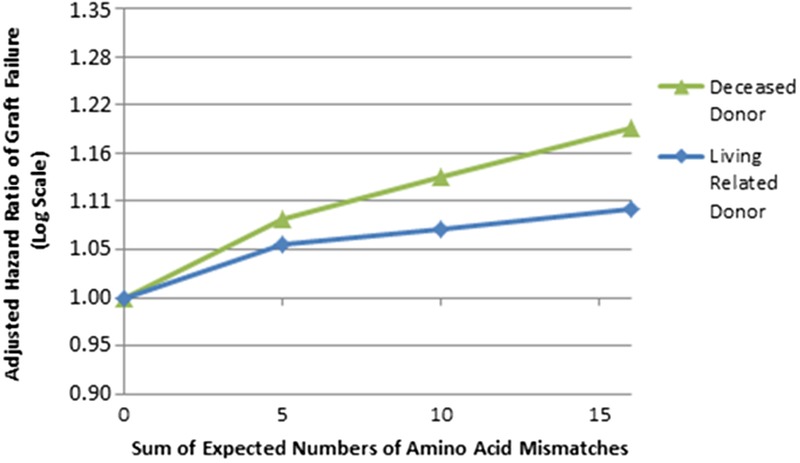
FIGURE 1.

Adjusted HR of GF by sum of expected number of AA MMs at HLA-DRB1. This figure shows the adjusted, log-scale HR of GF by expected number of HLA-DRB1 AA MMs; figure shows results of models of all races combined. Zero HLA-A, -B, -DRB1 antigen mismatched transplants were excluded from these analyses. Estimated HRs for all loci were calculated based on 0 MMs as the reference using the initial slopes plus spline factors to model the degree of change in slope at 5, 10, and 15 in a single model adjusted for patient risk factors, donor risk factors, and HLA-A, -B, and -DRB1 antigen MMs. Splines at 5, 10, and 15 AA MMs were chosen primarily due to the distribution of the number of AA MMs. The initial slope of HLA-DRB1 AA MMs had a P < 0.0001 and 0.06 for deceased donor and living related donor transplants, respectively.
