
FIGURE 2.
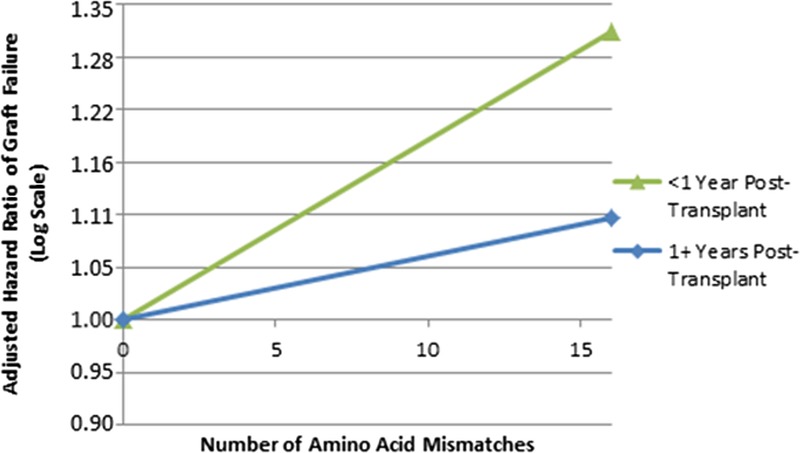
Association of HLA-DRB1 AA MMs with GF in separate posttransplantation intervals. This figure shows adjusted, log-scale HRs of GF by expected number of HLA-DRB1 AA MMs; models are based on 10 imputations as described in the Materials and Methods; figure shows results of models of all races combined. Zero HLA-A, -B, -DRB1 antigen mismatched transplants were excluded from these analysis. Estimated HRs were calculated based on 0 MMs as the reference using the modeled linear slopes in the log hazard, in a single model adjusted for patient risk factors, donor risk factors, and HLA-A, -B, and -DRB1 antigen MMs. The linear terms for HLA-DRB1 were statistically significant (P < 0.0001) for both models of GF in the first year after transplant as well as 1+ years posttransplant (all transplants combined). The AA MM variables evaluated in this analysis were selected by arbitrarily including only 1 site for each 2 highly correlated AA mismatched sites (r2 > 0.70) at each HLA locus. The following 23 variable sites were used for HLA-DRB1: positions 9, 10, 13, 14, 16, 26, 28, 31, 32, 33, 37, 38, 40, 47, 57, 58, 67, 70, 71, 74, 77, 85, and 86.