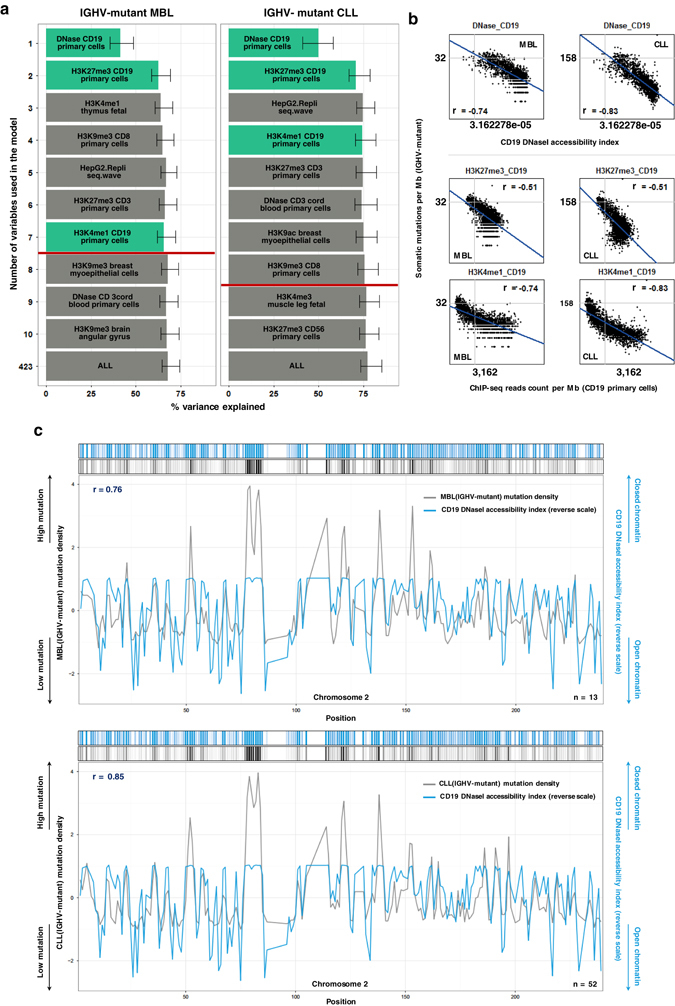
Fig. 2.

Cell-of origin chromatin features representing association with the regional mutation frequency of CLL and the corresponding precancerous cell type, MBL. a Random forest regression-based chromatin feature selection in relations to the regional mutation frequency of IGHV-mutant MBL and CLL samples. Each chromatin feature is ranked by importance value, and variance explained scores are represented by bar length. Error bars demonstrate minimum and maximum values derived from 1000 repeated simulations. Red lines display variance explained scores determined by 423 features—1 SEM, and CD19 chromatin features are green-colored. b Univariate correlation between CD19 chromatin features that displayed significance in the feature selection models and the regional mutation density of IGHV-mutant MBL or CLL. Spearman’s rank correlations (r) are shown on each plot. c The density plot for regional mutation density of IGHV-mutant MBL or CLL and CD19 DNase1 accessibility index (reverse scale) across the full chromosome 2. Spearman’s rank correlations (r) are shown on each plot
