Fig. 3.

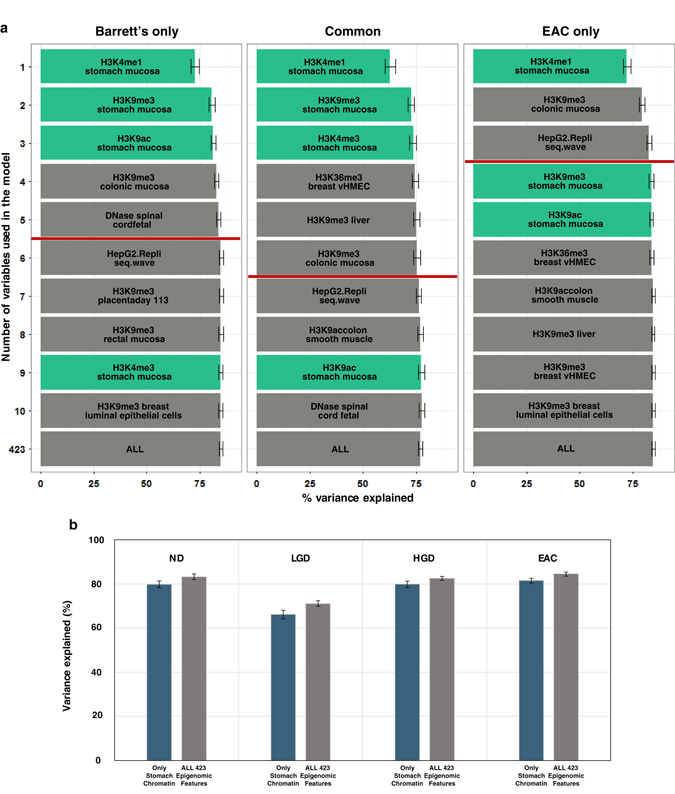
Regional mutation frequency landscape of Barrett’s esophagus and matching esophageal adenocarcinoma are affected by cell-type-shift-associated epigenetic changes. a Chromatin feature selection based on the commonality of mutations in paired samples of Barrett’s esophagus and esophageal adenocarcinoma. Barrett’s only: mutations observed only in the Barrett’s esophagus genome, Common: mutations observed in common for both Barrett’s esophagus and esophageal adenocarcinoma genomes, EAC only: mutations observed solely in the esophageal adenocarcinoma genome. b Bar graph representing average variance explained scores using either stomach chromatin features (navy) or all 423 epigenomic features (gray). ND: no dysplasia, LGD: low-grade dysplasia, HGD: high-grade dysplasia, EAC: esophageal adenocarcinoma. Error bars demonstrate minimum and maximum values derived from 1000 repeated simulations
