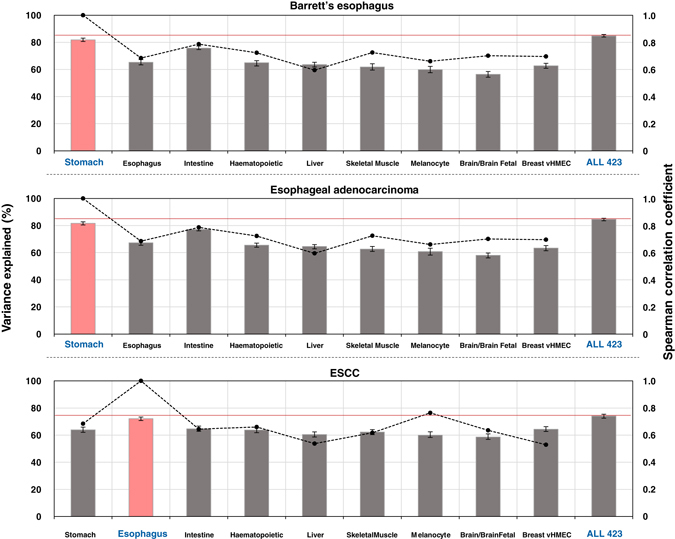
Fig. 4.

Regional mutation frequency landscape of esophageal squamous cell carcinoma demonstrates the uniqueness of significant chromatin features associated with the Barrett’s esophagus and esophageal adenocarcinoma genomes. Average variance explained scores for pre-cancerous or matching cancer genomes were separately calculated using the tissue or cell type-based subgroup-classified chromatin features. The pink panel represents subgroups with the highest variance explained score for each cell type. The red line indicates the variance explained score when using all 423 epigenomic features. Dots represent the Spearman’s rank correlations (r) of chromatin features between the highest variance explained-scored subgroup and the remaining subgroups. Error bars demonstrate minimum and maximum values derived from 1000 repeated simulations
