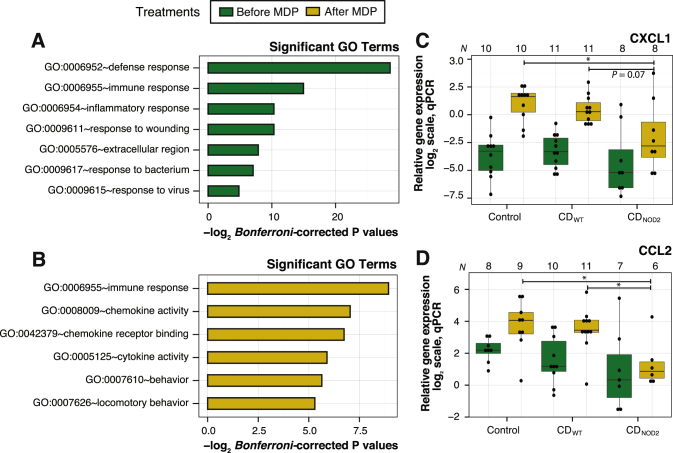
Fig. 3.
Functional annotation of differentially expressed genes between subject groups. a Enriched significant GO terms (Bonferroni-corrected P-values ≤ 0.05) for differential expressed genes between subject groups before MDP treatment. X-axis shows –log2(Bonferroni-corrected P-values) and Y-axis shows GO terms. b As in a, but showing significant GO terms for differential expressed genes between subject groups after MDP treatment. c qPCR validation for a selected chemokine, CXCL1, which exhibits a large difference between the subject groups after MDP treatment. X-axis shows subject groups before (dark green) and after MDP treatment (yellow). Numbers on top of the plot indicate the number of biological replicates passing the qPCR thresholds. Each subject is visualized as black dots. Y-axis shows the relative gene expression in log2 scale. Asterisks indicate level of significance (two-sided t-test): * indicates P ≤ 0.05, **P ≤ 0.01, and ***P ≤ 0.001. A single comparison with a P-value close to the significance threshold is indicated. d qPCR validation for a selected chemokine, CCL2, following the conventions of c

