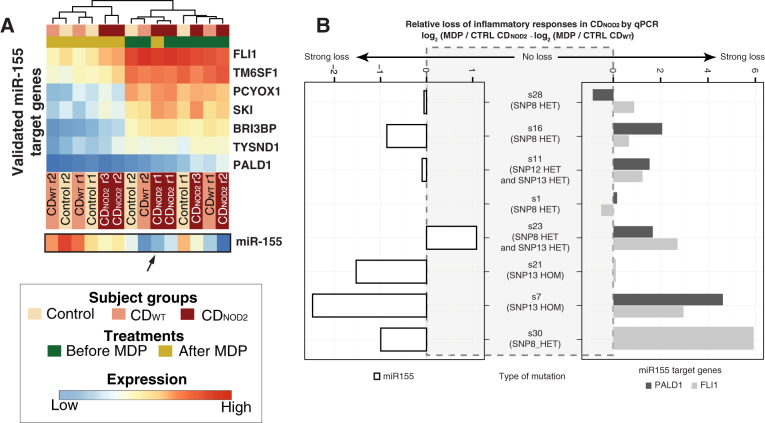
Fig. 6.
Classification power and variability of miR-155 and its targets across CDNOD2 patients. a Heat map as in Fig. 2a showing the expression pattern of the seven genes interacting with miR-155 indicated in a. The expression of miR-155 in corresponding libraries is indicated below the heat map. The black arrow highlights the outlier CDNOD2 subject that shows no substantial response to MDP. b Degree of response changes of individual CDNOD2 patients compared to the average response of CDWT patients from the exploratory cohort on miR-155 level (left panel) and two selected miR-155 target genes (PALD and FLI1, right panel). The plot follows the same conventions as Fig. 4h

