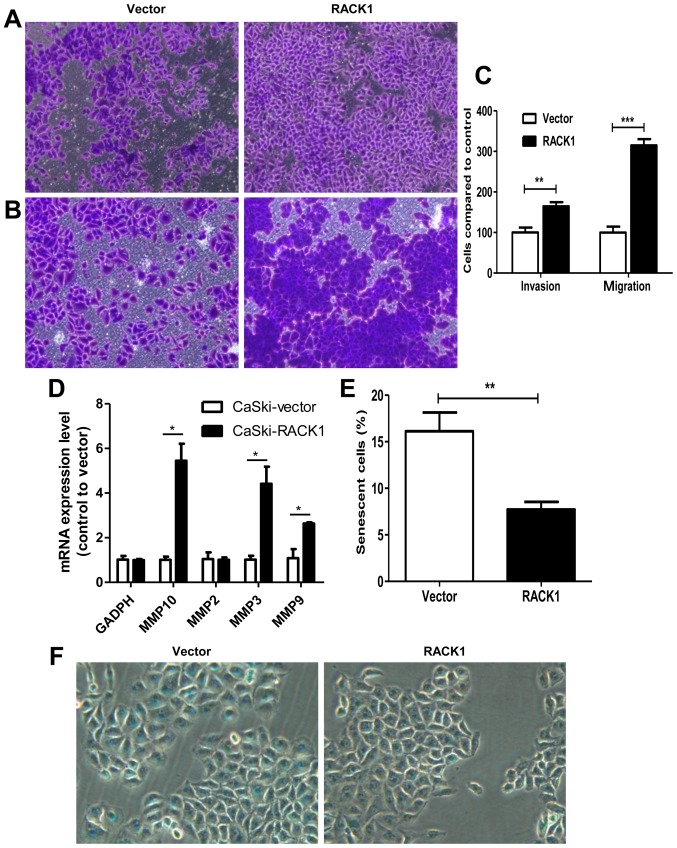
Figure 3.
Transwell invasion and migration assay and β-galactosidase staining assay between CaSki-RACK1 cells and CaSki-vector cells. (A) Transwell migration assay. (B) Transwell invasion assay. (C) Statistical analysis of cell number for Transwell invasion and migration assays. Results are presented as mean ± SD from three independent experiments. (D) mRNA expression levels of MMP-2, MMP-3, MMP-9 and MMP-10. (E and F) β-galactosidase staining and statistical analysis of cell numbers for β-galactosidase staining assay. The assay was conducted as three independent experiments. *P<0.05; **P<0.01; ***P<0.001.

