Figure 2.
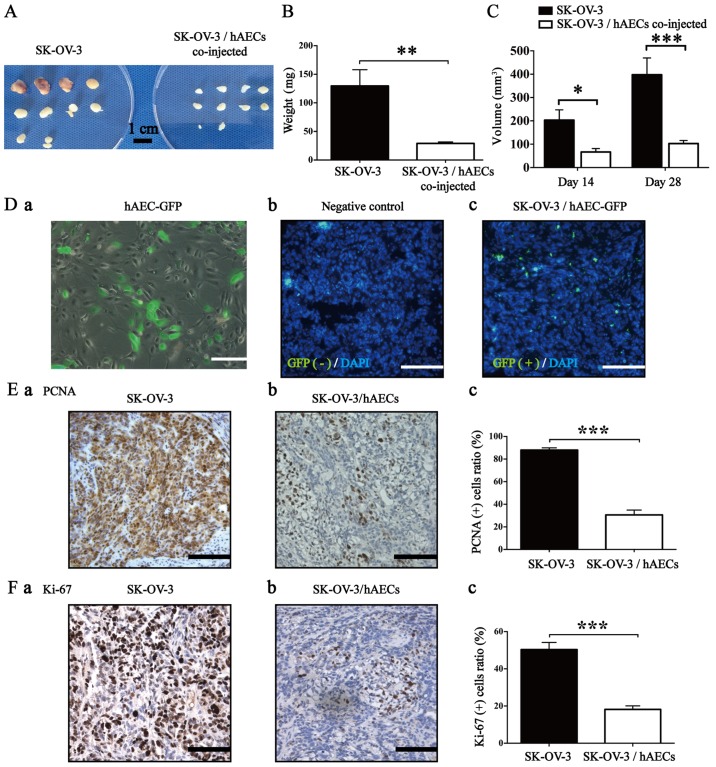
hAECs inhibit growth of SK-OV-3 cells in vivo. (A) Gross observation of subcutaneous xenografts obtained from SK-OV-3 injected group and SK-OV-3/hAECs co-injected group (scale bar, l cm). (B) The average tumor weight of SK-OV-3 injected group was significantly higher than that of SK-OV-3/hAECs co-injected group at day 28 (n=10). (C) The average tumor volume of SK-OV-3 injected group was significantly bigger than that of SK-OV-3/hAECs co-injected group at day 14 and day 28 (n=10). (D) (a) Representative image of GFP-transfected hAECs (scale bar, 200 µm). (b) We did not find positive signal of hAECsGFP+ in the negative control (scale bar, 100 µm). (c) The positive signals were found in the xenografted tumor tissues obtained from SK-OV-3/hAECsGFP+ injected group (scale bar, 100 µm). (E and F) Proliferation of cancer cells were tested by IHC using antibodies against PCNA and Ki-67 in SK-OV-3 and SK-OV-3/hAECs tumor tissues (scale bar, 100 µm; n=5). Data were analyzed by Mann-Whitney U test and were represented as means ± SEM. *p<0.05, **p<0.01 and ***p<0.001.

