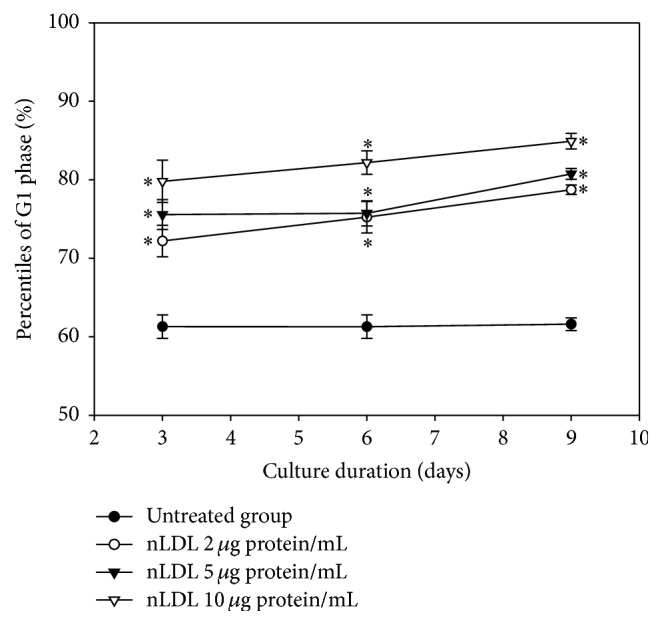
Figure 3.

G1 arrest induction in HUVECs by long-term treatment with nLDL. Cell cycle was assayed by flow cytometry in the nLDL-treated cells, for up to 9 days, at the end of each subculture. The distribution percentiles of G1 phase cells after nLDL treatment (0, 2, 5, and 10 μg protein/mL) were shown as a line graph. The dose- and time-dependent differences in G1 phase distribution between groups were analyzed statistically by repeated measures ANOVA assay (p < 0.01). Each nLDL-treated group was also compared with the respective nLDL-untreated group by independent t-test (∗p < 0.01). Each result represents the mean ± SD (n = 6).
