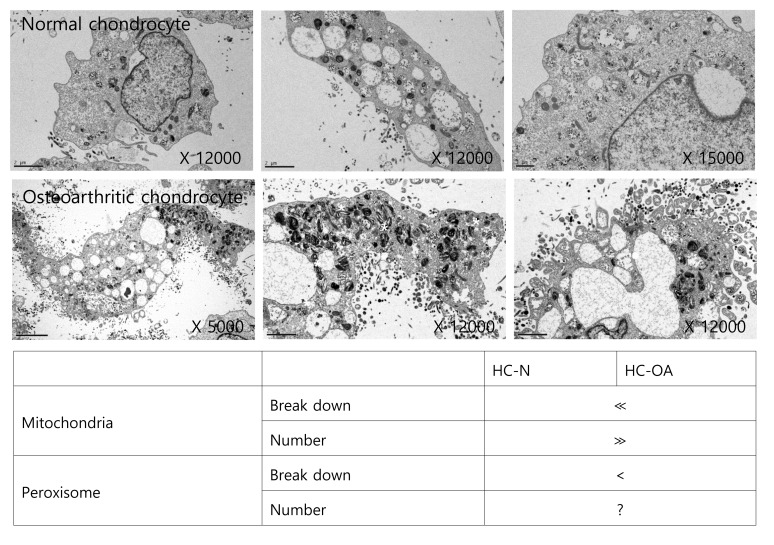
Figure 2. Mitochondrial and peroxisomal dysmorphology in osteoarthritis chondrocytes.
TEM images of human non-osteoarthritis chondrocytes and osteoarthritis chondrocytes (upper panel) were analyzed (lower panel). *indicates abnormal mitochondria and peroxisome. The data shown are representative of three independent experiments.

