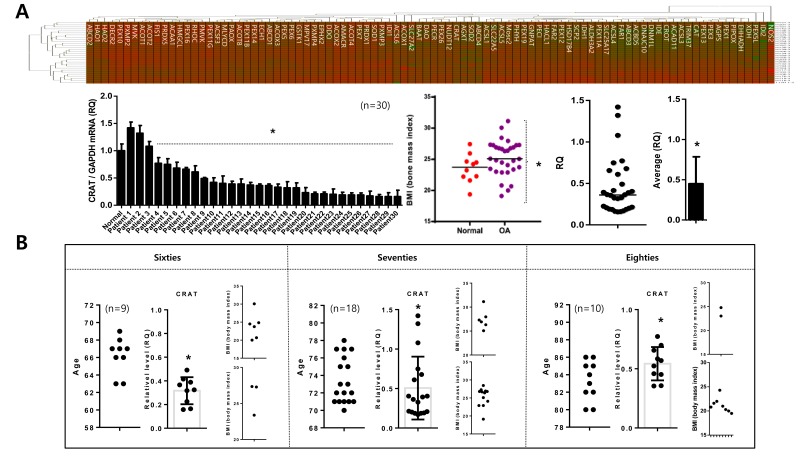
Figure 3. Peroxisomal gene profiling in normal and osteoarthritis chondrocytes.
A. Chondrocytes (normal and non-osteoarthritis) were isolated, and peroxisomal gene profiles were analyzed, represented as a heat map (upper panel). “Red” and “Green” indicates high and low relative expression, respectively. Similarly, the heat map for chondrocytes (normal versus osteoarthritis) (upper panel) is shown. Body-mass indices (BMI) of patients used in this study (left), and relative quantification of CRAT (expressed as fold difference compared with normal chondrocytes) are represented as dot graphs (lower panel). B. CRAT expression was analyzed by age represented as dot graph.

