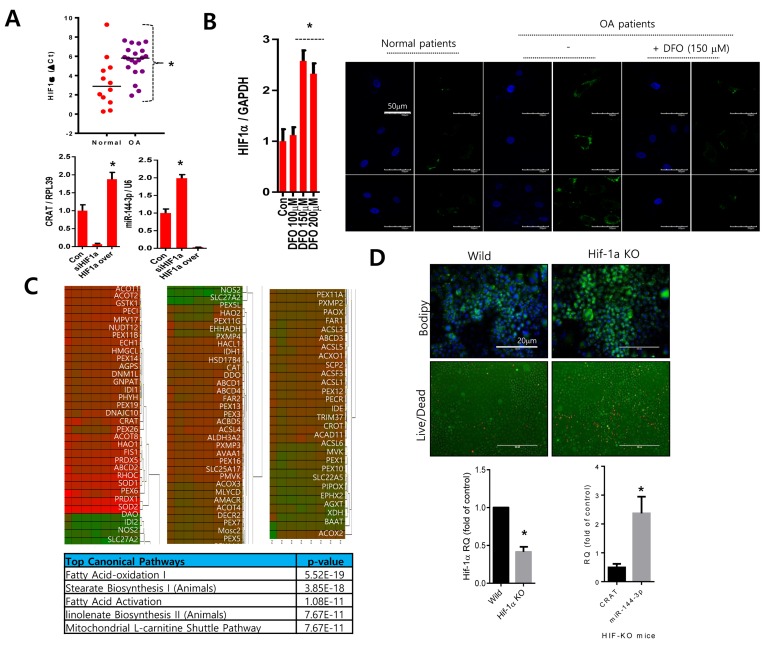
Figure 6. HIF-1α might regulate the CRAT:miR-144-3p axis.
A. The HIF-1α expression level was analyzed by PCR in normal or osteoarthritis chondrocytes (upper panel). Normal chondrocytes were infected with lentiviruses containing HIF-1α-specific siRNA (siHIF-1α) or HIF-1α, and the expression levels of CRAT and miR-144-3p were analyzed by PCR (lower panel). B. Osteoarthritis chondrocytes were treated with desferrioxamine (DFO) and stained with BODIPY. C. Peroxisomal gene profiles were analyzed and represented as a heat map (upper panel). The IPA generated top canonical pathways, and possible upstream regulators are shown (lower panel). D. Articular chondrocytes isolated from HIF-1α knock-out mice were stained with BODIPY and live and dead assay kit (upper panel) and the expression levels of HIF-1α, CRAT, and miR-144-3p was analyzed by PCR. Bars represent the mean ± SD of three individual experiments. *P < 0.05 versus control.

