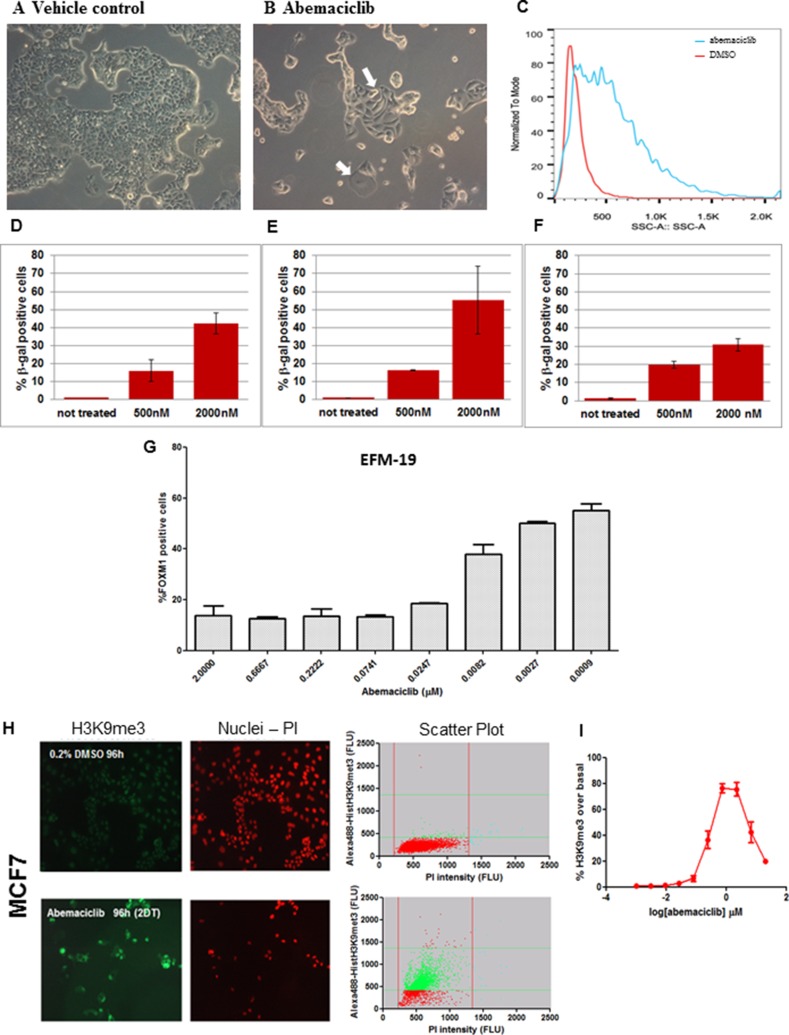
Figure 3. ER+ breast cancer cell lines treated with abemaciclib showed morphological changes, increased β-gal expression and chromatin changes consistent with senescence.
(A, B) MCF7 cells were treated with DMSO 0.2% (A) or 0.5 µM abemaciclib (B) for 3DT and images were taken at 100x by bright field microscopy (Leica DMiL). White arrows indicate evident morphological changes enlarged and flatten cytoplasm upon treatment with abemaciclib. (C) MCF7 cells were treated with either DMSO (red line) or 0.5 µM of abemaciclib (blue line) for 3 DT and side scatter (SSC) analysis was carried out using flow cytometry and analyzed with FlowJo X software. (D–F) MCF7 cells were treated with abemaciclib for 2 days (D), 7days (E), or 10 days (F) and β-gal was measured by high-content imaging (HCI). For abemaciclib treated samples (n =2), and for untreated cells (n = 6), the means (SD) are plotted. (G) EFM-19 cells were treated for 1DT with abemaciclib at the indicated concentrations. FOXM1 positive cells were detected by HCI; signal for % FOXM1-positive cells is expressed as mean (SD) (n = 2 for abemaciclib treated samples and n = 4 for untreated samples). (H) MCF7 cells were treated with DMSO or 0.5 µM abemaciclib for 2DT and immunofluorescence was carried out with an H3K9me3 antibody and PI. Microscopy images are shown on the left and scatter plots of total and H3K9me3 positive cell populations are represented on the right (Red = nuclei; green = H3K9me3 positive cells). (I) MCF7 cells were treated for 2 DT with different concentrations of abemaciclib. The % of H3K9me3 positive cells was obtained by normalizing versus a control population and expressed as the number of objects stained with H3K9me3 antibody; the mean (SD) of 2 independent experiments at each concentration is plotted.

