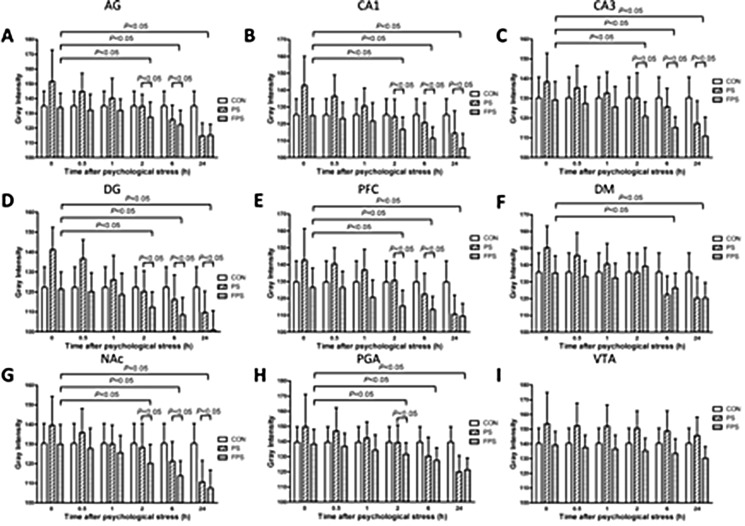
Figure 2. 255-grey intensity quantification of BDNF mRNA expression at different time points after psychological stress exposure in the selected brain regions in the CON, the PF and the FPS groups.
BDNF mRNA expression, negatively correlated with the gray intensity values, were quantified from ISH staining in different brain regions including AG (A), hippocampus CA1 (B), CA3 (C), DG (D), PFC (E), DM (F), NAc (G), PAG (H), and VTA (I) at 0, 0.5, 1, 2, 6 and 24 hours after psychological stress exposure. Data are presented as mean ± SE, n=5 for each group at each time point. Data were analyzed by two-way ANOVA followed by a post hoc test using the least significance difference method (LSD). P < 0.05: significant difference between the marked two groups or subgroups.

