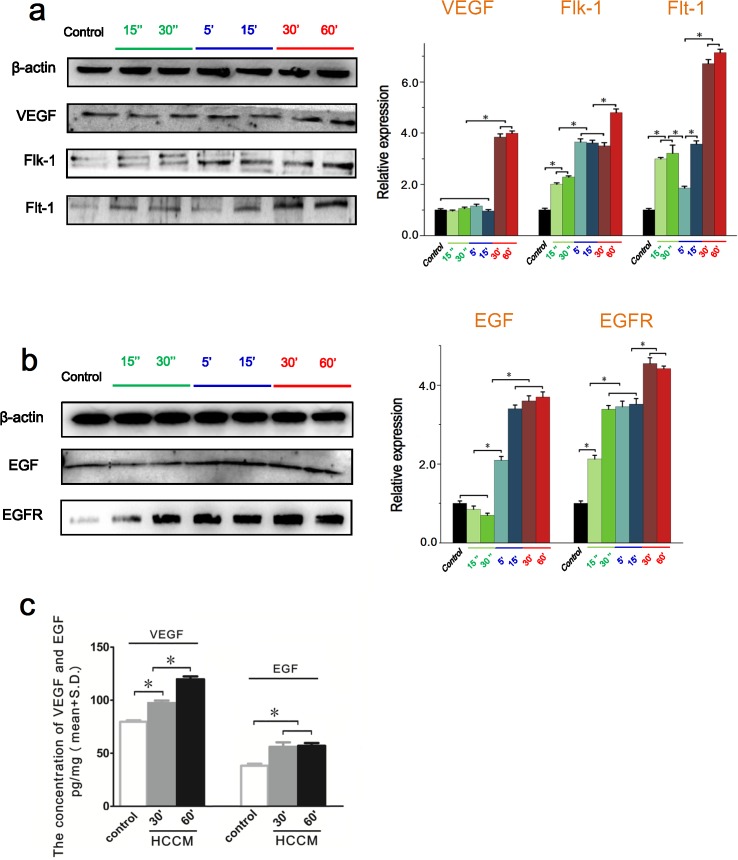
Figure 3. The intracellular expression and the extracellular content of VEGF/EGF in endothelial EA.hy926 cells with HCCM.
(a) The expression of VEGF, Flt-1 and Flk-1 in EA.hy926 cells. Their expression levels were quantified by image analysis of the Western blot bands. The expression of β-actin in each group was used as intrinsic controls, and relative expressions of VEGF, Flt-1 and Flk-1 were calculated. (b) The expression of EGF and EGFR in EA.hy926 cells. The expression levels were quantified by image analysis of the Western blot bands. The expression of β-actin in each group was used as intrinsic controls, and relative expressions of EGFand EGFR were calculated. (c) The concentration of the VEGF and EGF secreted by EA.hy926 cells with HCCM. The initial concentrations of VEGF and EGF in HCCM are defined as controls. Values represent the Mean±S.D from three independent experiments. *, P<0.05 denotes statistically significant difference compare with other groups.

