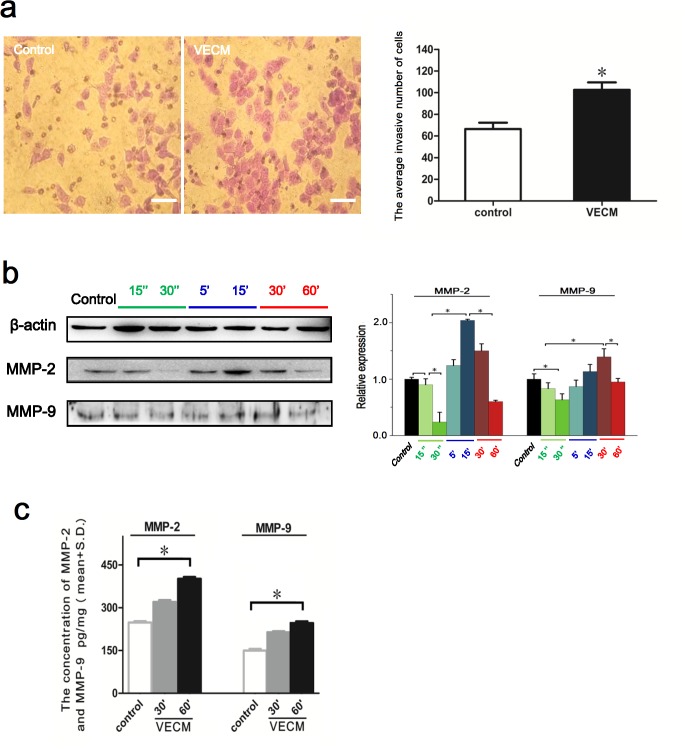
Figure 4. The effects of EA.hy926 conditioned medium on the invasive ability of HepG2 cells.
(a) Typical optical images of HepG2 cells which crossed through the pores of Transwell chamber and stained with crystal violet, illustrating invasive cells stimulated by VECM. Scale bar=30μm. The numbers of invasive cells from the images were quantitatively analyzed. *, P<0.05 denotes statistically significant difference compare with control. (b) The expressions of MMP-2 and MMP-9 in HepG2 cells. Their expression levels were quantified based on image analysis of the Western blot bands. *, P<0.05 denotes statistically significant difference compare with other groups. (c) The concentration of the MMP-2 and MMP-9 secreted by HepG2 cells with VECM. The initial concentrations of MMP-2 and MMP-9 in HCCM are defined as controls. Values represent the Mean±S.D from three independent experiments.

