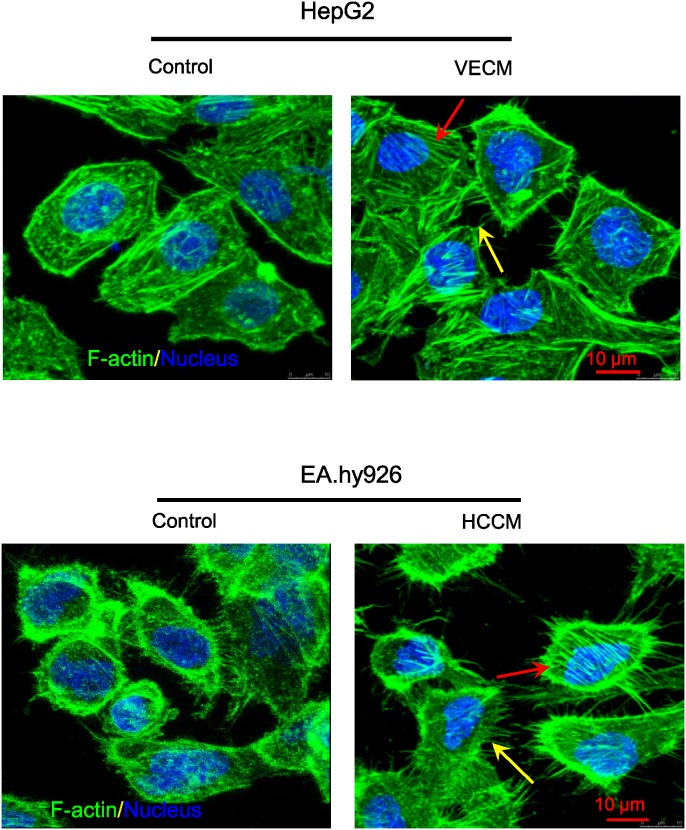
Figure 6. The HCCM and VECM induced F-actin distribution and arrangement in EA.hy926 cells and HepG2 cells, respectively.
The red and yellow arrows in figures showed the fiber structure in the cell body and filopodia/lamellipodia at the edge of cell protrusions, respective. green: F-actin; blue: nucleus, scale bar = 10 μm.

