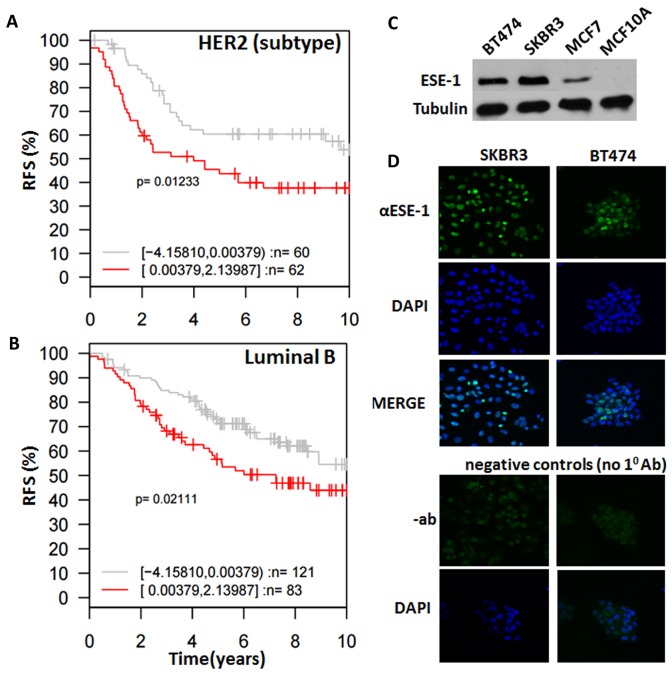
Figure 2. ESE-1 dictates subtype specific clinical outcomes and is detected in the nucleus of HER2+ cell lines.
(A, B) Kaplan Meier survival curves of patients stratified by ESE-1 expression level and clinical subtypes of cancer generated by GOBO. PAM50 subtype classification was generated by GOBO according to gene expression subtypes reported by Parker et. al [28]. Plots show that HER2 subtype (A) and Luminal B (B) breast cancer patients that have high ESE-1 expression present experience significantly shorter relapse free survival, compared to patients with low ESE-1 expression in 10-year follow up studies. (C) Western blot of whole cell extracts generated from SKBR3, BT474, MCF-7, MCF10A cells and probed with the anti-ESE-1monoclonal antibody mAB405 and a mouse monoclonal anti-Tubulin. (D) Immuno-cytochemical analysis of ESE-1 expression in SKBR3 and BT474 HER2+ cells. The top row shows the confocal images of SKBR3 and BT474 probed with anti-ESE-1 mAb405, followed by a Cy3 conjugated goat anti-mouse secondary antibody. Both SKBR3 and BT474 are positive for green in the nucleus. Top middle row shows the same cells stained with DAPI to outline the nuclei, and the third row shows the merge of the top two rows. Shown at the bottom are the negative controls, depicting the confocal images of the same cells probed with blocking solution and the Cy3-conjugated goat anti-mouse secondary antibody but omitting the anti-ESE-1 mAb. The down bottom row shows the confocal images of DAPI stained, negative control cells.

