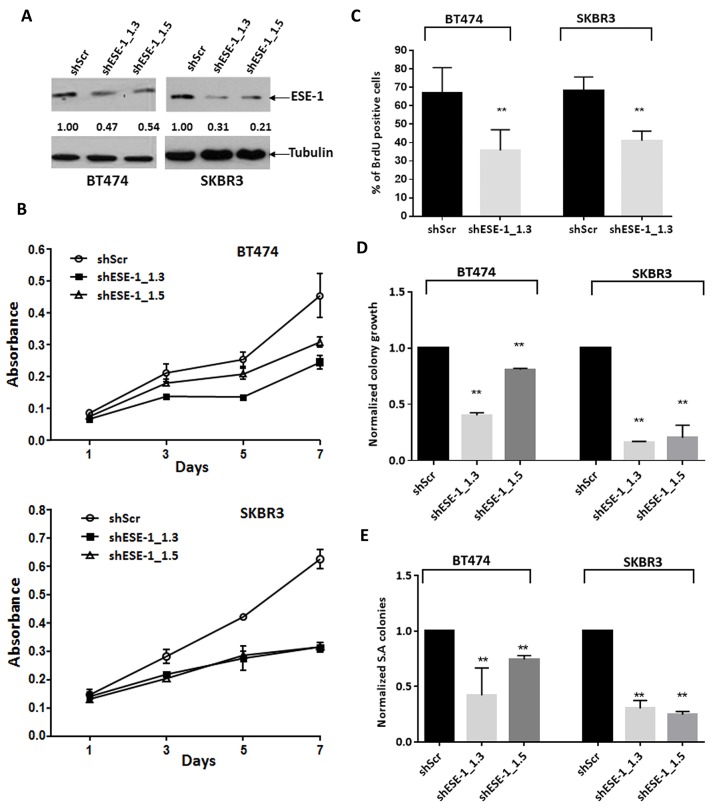
Figure 3. ESE-1 KD inhibits the transformation phenotype in BT474 and SKBR3 HER2+ cells.
(A) ESE-1 knockdown after sESE-1_1.3 and shESE-1_1.5 lentiviral transduction in BT474 and SKBR3 cells.Arbitrary densitometric units (ADU) measuring the ESE-1 densitometry signal normalized against tubulin, with the shScr set to 1, is shown under each protein signal as a number. (B) Cell growth assay by crystal violet staining. Data shown is a representative of four biological replicates. (C) Quantification of BrdU positive cells in BT474 and SKBR3 cells with stable knockdown of ESE-1, relative to the scramble control at 8 days and 3 days post transduction respectively. Figure shown is a representative of 3 replicates. Negative control was incubated with a non-specific IgG for primary antibody. The shESE-1 mediated reduction in proliferation is significant to p=0.012 in BT474 cells and to p=0.020 in SKBR3 cells over three biological replicates. (D) Direct quantification of BT474 and SKBR3 2D colonies stained with crystal violet using a macro built into NIH Image J software after stable knockdown of ESE-1. The shESE-1 mediated colony reduction in BT474 cells is significant to p=0.002 for shESE-1_1.3 and p=0.02 for shESE-1_1.5. The reduction is statistically significant to p=0.0002 for SKBR3 cells. Data shown are average of three independent experiments, each normalized to the scramble control, which was set to 1. (E) Quantification of SKBR3 and BT474 soft agar colonies stained with tetrazolium nitroblue using the Image J software. In BT474 cells, colony reduction is statistically significant to p=0.002 with shESE-1_1.3 and p=0.024 with shESE-1_1.5. The shESE-1 mediated colony reduction is statistically significant to p=0.0001 in SKBR3 cells. Data shown are an average of three independent experiments, each normalized to the scramble control set to 1. All error bars are represented as +/- SEM.

