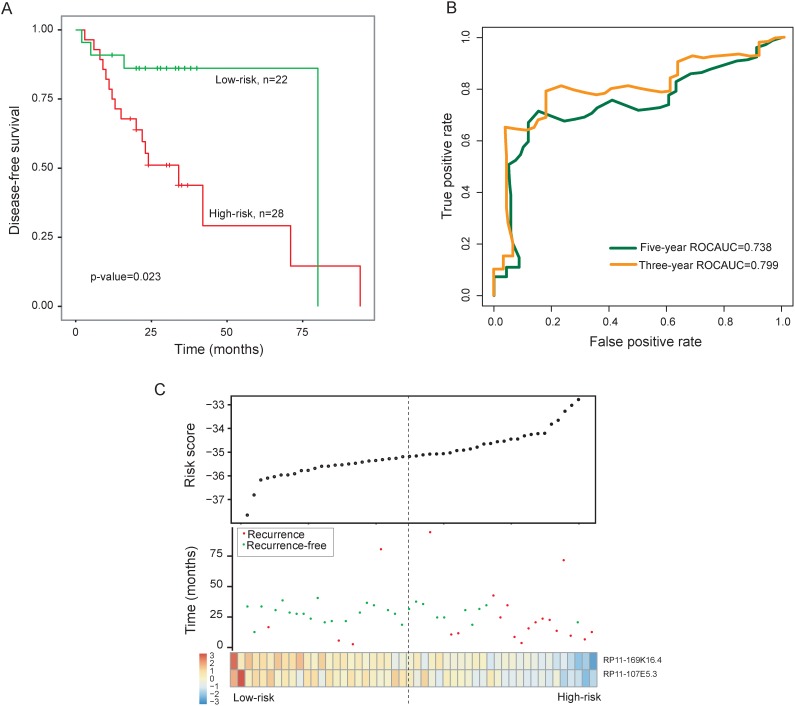
Figure 1. Prognostic assessment of the two-lncRNA signature in the training dataset.
(A) Kaplan-Meier survival curves of overall survival between high-risk group and low-risk group in the training dataset. (B) Time-dependent ROC curves of the two-lncRNA signature at 36 and 60 months of disease-free survival. (C) Presentation of risk scores, survival status and lncRNA expression pattern in high-risk and low-risk groups

