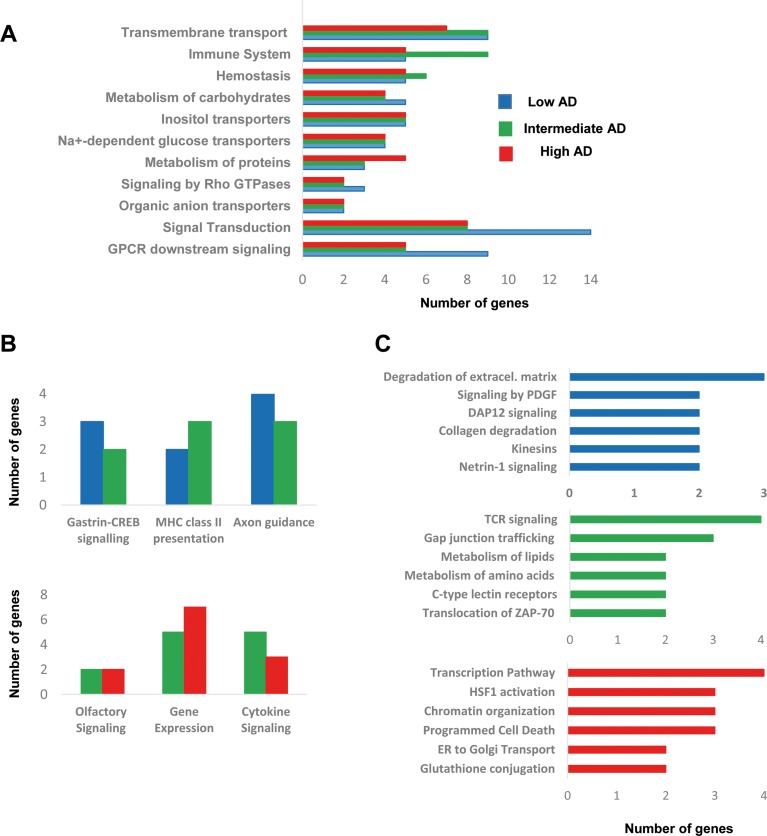
Figure 4. Functional metrics of the differential OB transcriptome across AD staging.
Specific pathway analysis for the differential OB transcriptome detected in each AD stage is shown. Blue, green, and red bars correspond to functional deregulated categories in low, intermediate, and high AD stages respectively.

