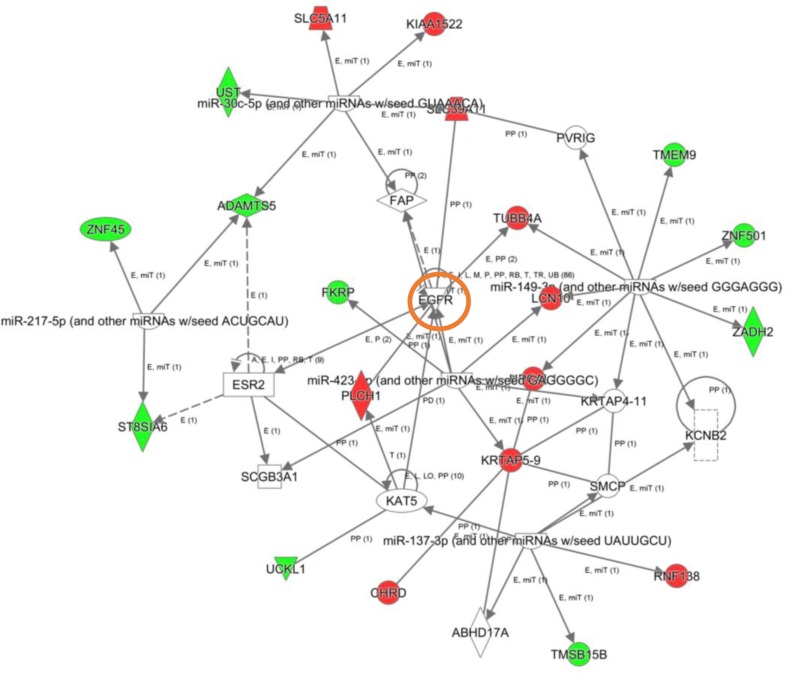
Figure 5. High-scoring gene interactome map for early differentially expressed genes in the OB during AD progression.
Visual representation of the relationships between differential expressed genes and functional interactors in low AD stage. Dysregulated genes are highlighted in red (up-regulated) and green (down-regulated). Continuous and discontinuous lines represent direct and indirect interactions respectively. The complete legend including main features, molecule shapes, and relationships is found at http://ingenuity.force.com/ipa/articles/Feature_Description/Legend.

